In response to a member question:
Have you ever looked at a systematic approach that invested only in tactical asset allocation strategies that were experiencing a significant drawdown? We know that performance chasing is a flawed behavioral bias, so an approach like this could exploit it.
We always appreciate thoughtful questions like this from members. First off, we can confirm that chasing recent top performing strategies is a bad idea. We’ve covered this previously.
We track more than 50 published asset allocation strategies, so we’re in a unique position to answer the drawdown question, not just for a particular strategy, but for TAA as a whole. The short answer is that yes, historically TAA strategies have outperformed when approaching a previous maximum drawdown.
Our test:
We use the first 20 years of backtested data for each strategy to find the maximum drawdown up to that point in time. The earliest any of the strategies on our platform begins is 1970, so this analysis begins in 1990. (*)
We then ask, if we invested in that strategy when it was within X% of the max drawdown and then held it for the next Y-months, how would it have performed versus all other days? Note: we’re only looking at drawdowns up to that point in time, so there’s no lookahead bias in these results.
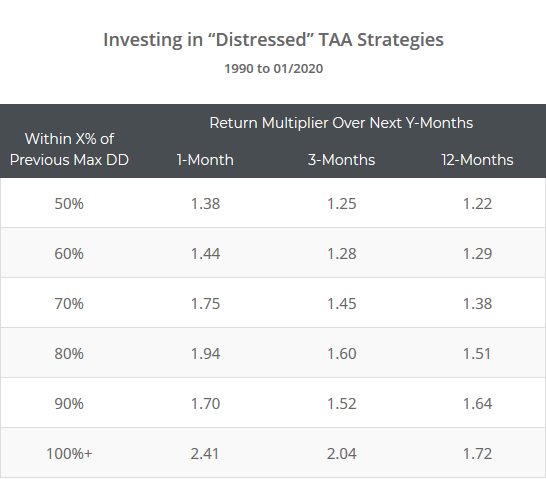
Across all reasonable values for X (50 – 100%) and Y (1 – 12 months), performance was higher after approaching a previous max drawdown. A sample of 1, 3 and 12-month return multiples for various values of X follow.
How to read these results: By “return multiple” we mean the annualized return during that period versus all baseline days. So if a strategy produced a 10% annualized return during all baseline days, but a 15% return after approaching a previous max drawdown, the multiple would read 1.50x.
As the table illustrates, returns were significantly higher in our test, by a factor of 1.22x to 2.41x depending on the interpretation. The effect was pervasive, with between 76% (upper left of table) and 95% of strategies (bottom right of table) outperforming their baseline results.
Adding additional rules like requiring that a strategy begin to recover before investing, didn’t bear fruit. This effect is really about “catching the falling knife”. That’s always dangerous as this time can always be different. By definition, a strategy’s max drawdown is always in the future. It could be tomorrow or it could be 1,000 years from now, but it’s always out there somewhere. So apply the appropriate caution.
Explaining these results:
If these were buy & hold strategies, we would chalk these results up to mean reversion in the underlying assets. But these are primarily active, tactical strategies.
We assume what we’re seeing are moments when strategies were offensively allocated, got it wrong which led to big initial losses, then switched to a more defensive posture and began to recover from those losses. More study would be required to further flesh this out.
One more note about these results:
The number of strategies approaching a previous max drawdown at any given time tends to cluster. Most of the time, no strategies are approaching their max drawdown. For example, in only about 27% of months was at least one strategy within 80% of a previous max.
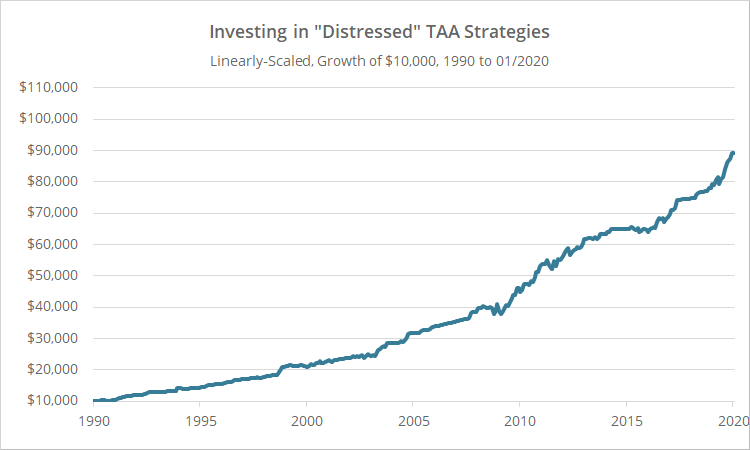
That means that “only buying distressed strategies” probably isn’t a complete strategy unto itself. To illustrate, in the graph below we’ve assumed that an investor allocated equally to all strategies that were within 80% of a previous max drawdown within the last 12-months, otherwise to cash (3-month UST). Ultra smooth returns, but not a lot of meat on the bone (annualized return = 8.1%).

Linearly-scaled. Click for logarithmically-scaled results.
Replicating this approach:
Members can find the current drawdown for all strategies on the Strategy Screener. Click Columns & Filters – Columns to Display – Current Drawdown. Dividing the strategy’s current drawdown by the maximum drawdown would give you the value of X in the results above.
New here?
We invite you to become a member for about a $1 a day, or take our platform for a test drive with a free limited membership. Put the industry’s best tactical asset allocation strategies to the test, combine them into your own custom portfolio, and follow them in near real-time. Not a DIY investor? There’s also a managed solution. Learn more about what we do.
Calculation notes:
- An assumption for trading friction (transaction costs + slippage) has been included in the backtested results for individual strategies, but has not been included for entering/exiting strategies. That would require a number of hours spent writing code that’s hard to justify for a one off, ad hoc report. We would not expect this to affect the general conclusion of this report.
- The results shown here include “overlapping” instances of a strategy within X% of a max drawdown, i.e. it’s within X% this month and it counts for the next Y-months, it’s within X% next month and it counts again. We tested both ways, overlapping and non-overlapping, and the results were highly similar.
- Some strategies never re-approached a previous max drawdown (after the initial 20-year window) so they have not been included here.
(*) Technically speaking, by 1970 we mean the market close on 12/31/1969, and by 1990 the market close on 12/29/1989.

