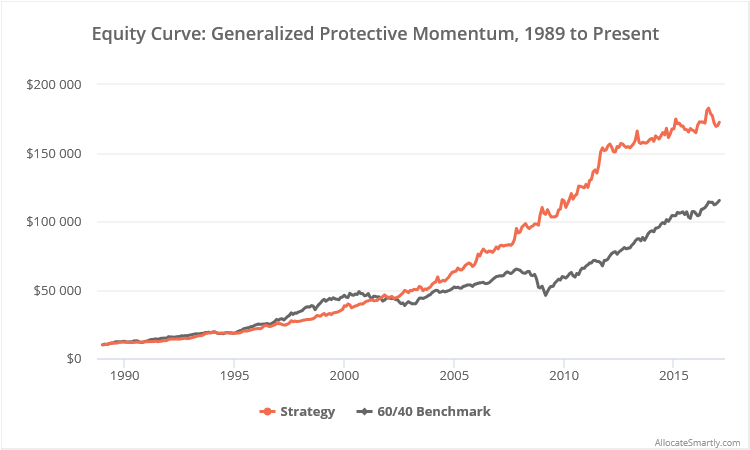
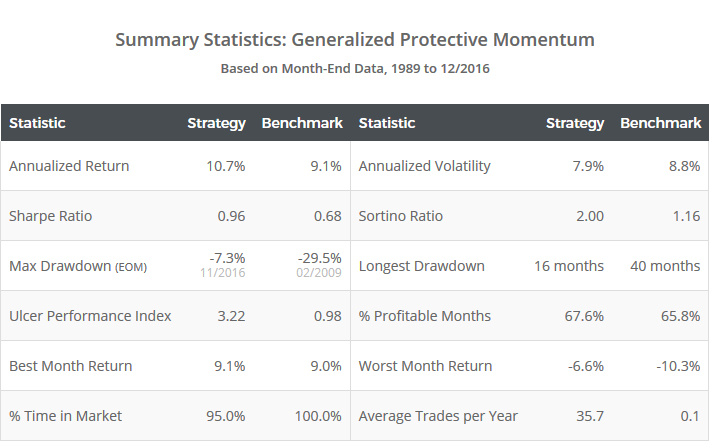
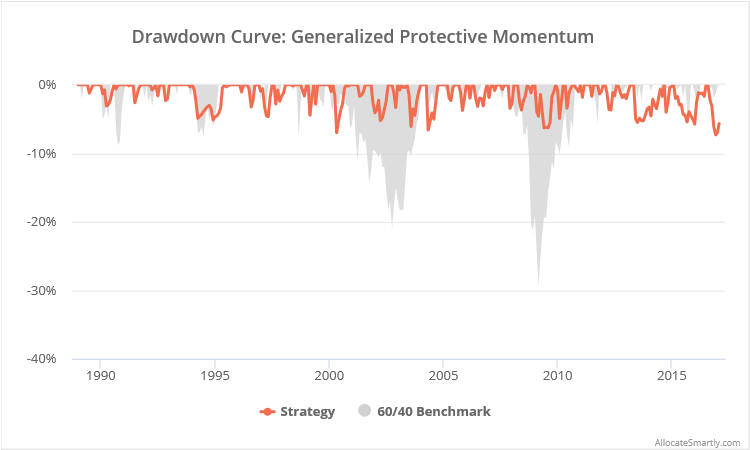
This is a test of the Generalized Protective Momentum (GPM) strategy from JW Keuning and Wouter Keller. The strategy builds off of the authors’ popular Protective Asset Allocation (PAA) model that we discussed last month. Results for the GPM strategy from 1989, net of transaction costs, follow.
Read more about our backtests or let AllocateSmartly help you follow this strategy in near real-time.

Linearly-scaled. Click for logarithmically-scaled chart.
JW Keuning can be found on his blog TrendXplorer and Wouter Keller has published a number of papers that can be found on SSRN. They are two of the most creative minds in tactical asset allocation, and I highly recommend you follow them now.
About Generalized Protective Momentum (GPM):
GPM is very similar in most regards to Protective Asset Allocation (PAA). Both are monthly trading strategies, trading the same universe of global asset classes, based on both relative (aka “cross-sectional”) as well as absolute (aka “time series”) momentum. And both have done extremely well managing drawdowns by using a “crash protection” asset to protect the portfolio from excessive loss when just a handful of assets fail to show positive momentum.
Where they differ is that GPM also considers another important factor when selecting assets: correlation. The strategy is more likely to choose assets that are less positively correlated to other assets in the universe, which in most months produces a more diversified portfolio than PAA.
Strategy rules tested:
- At the close on the last trading day of each month, calculate ri, ci and zi for each of 12 risk assets, plus 2 crash protection assets (see end notes for a complete list), where:
- ri = average of the 1, 3, 6 and 12 month return of that asset
- ci = 12-month correlation between that asset and the equal-weight return of the 12 risk asset classes (rebalanced monthly)
- zi = ri * (1 – ci)
- To determine the % of the portfolio to allocate to the crash protection asset (CP) at the close, first calculate n where n equals the number of asset classes where zi > 0. If n <= 6, then allocate the entire portfolio to the CP asset, otherwise CP % = [(12 – n) / 6]. The CP asset is either IEF (intermediate-term US Treasuries) or cash. Select the one with the highest value for zi.
- Unless 100% allocated to the CP asset, also select the 3 risk assets with the highest zi value, and allocate 1/3 of the remaining portfolio to each at the close.
- Hold positions until the final trading day of the following month. Rebalance the entire portfolio monthly, regardless of whether there is a change in position.
 Like PAA, two key advantages of this strategy are: (a) how aggressively it increases allocation to the crash protection asset to protect the portfolio from excessive losses, and (b) the ability to switch from a longer to a shorter duration crash protection asset should we enter a new regime of rising interest rates. We talked about this in depth in our PAA analysis, and we recommend interested readers to go there for more information.
Why Generalized Protective Momentum (GPM) might be better than Protective Asset Allocation (PAA):
The PAA model only considers past returns when selecting risk assets each month. That approach has a tendency to become highly concentrated because a number of the assets traded behave similarly (even when their names imply otherwise). An example of a set of highly correlated assets include: US large and small equities, some international equities, real estate and high-yield bonds.
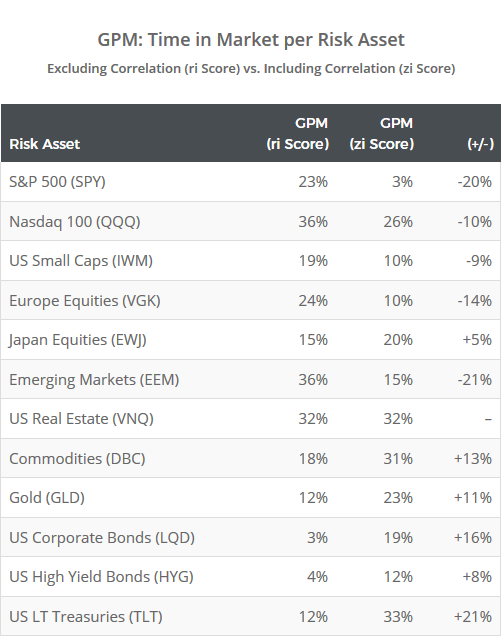
The GPM model tries to respond to this (via the zi score) by penalizing assets that are highly correlated to other assets in the universe. To illustrate, the table below shows how often the strategy would have selected each risk asset using the zi score as described above, versus a version that does not take correlation into account (i.e. only uses the ri score, almost exactly like PAA):
Note how many of the assets from our set of highly correlated assets (SPY, QQQ, IWM, VGK and EEM) saw a sharp decrease in allocation, while many diversifying assets (DBC, GLD, LQD and TLT) saw a sharp increase.
The net effect of this is that, in most months, GPM will select a more diversified portfolio than PAA.
So which is better?
Setting the numbers aside for a moment and applying a bit of logic. I would expect PAA to outperform in most months, because simply put, selecting asset classes exhibiting the strongest momentum works most of the time. But in times of market stress, I would expect the greater diversification offered by GPM to do a better job weathering the storm.
This is borne out by the numbers: in months when US stocks (SPY) fell, GPM outperformed PAA by 7.6% annualized. Given my risk averse nature, and the fact that no one can predict the market’s next rough patch with any certainty, I give the edge to GPM.
We invite you to become a member for less than $1 a day to track this and other excellent models in near real-time, or take our platform for a test drive with a free limited membership. Have questions? Learn more about what we do, check out our FAQs or contact us.
End notes:
A list of assets traded: S&P 500 (represented by SPY), Nasdaq 100 (QQQ), Russell 2000 (IWM), Europe equities (VGK), Japan equities (EWJ), emerging market equities (EEM), US real estate (VNQ), commodities (DBC), gold (GLD), US high yield bonds (HYG), US corporate bonds (LQD), long-term US Treasuries (TLT), and intermediate-term US Treasuries (IEF, crash protection asset).
Additional reading about GPM from JW Keuning:
- Generalized Protective Momentum (Seeking Alpha)
- Deciphering Correlation Hedged Momentum (TrendXplorer)
Note that there are minor differences in the assets we’ve chosen to represent each asset class versus those used by Keuning and Keller, but they are substantially similar. Also note that Keuning’s numbers use SHY (short-term US Treasuries) as the shorter duration crash protection asset. As we do throughout this site, we’ve assumed that any trades signaled for SHY were instead placed in “cash” (equal to the 3-month UST rate). We feel it’s a more appropriate choice in today’s environment of low interest rates given transaction costs and how frequently this strategy trades.


