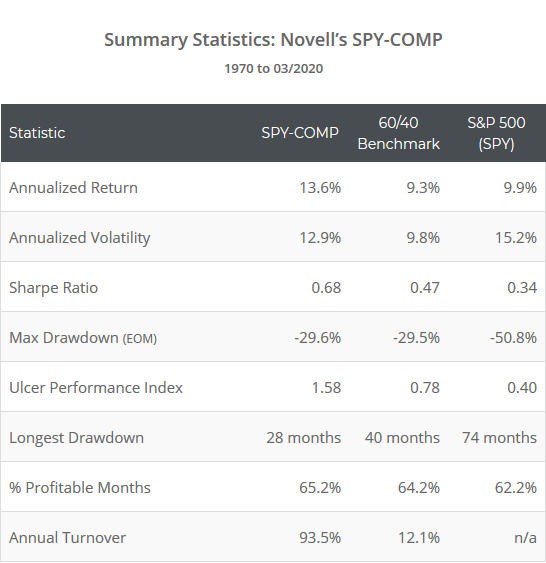
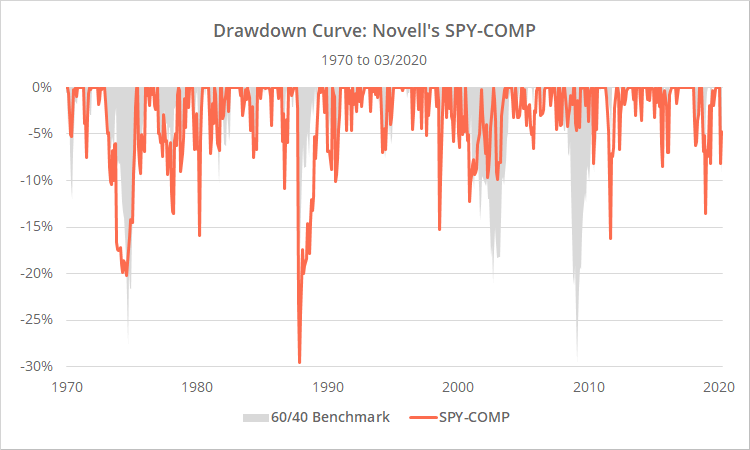
This is a test of the flagship proprietary strategy from Paul Novell’s Investing for a Living. Paul has been kind enough to share his strategy rules to allow for independent verification of his results.
SPY-COMP is like Growth-Trend Timing and a handful of other tactical strategies we track, in that it considers trends in both prices and key economic indicators to switch between risk and defensive assets. Where it differs from those other strategies is that it considers a much broader array of economic indicators.
Strategy results from 1970 follow. Results are net of transaction costs – see backtest assumptions. Learn about what we do and follow 50+ asset allocation strategies like this one in near real-time.
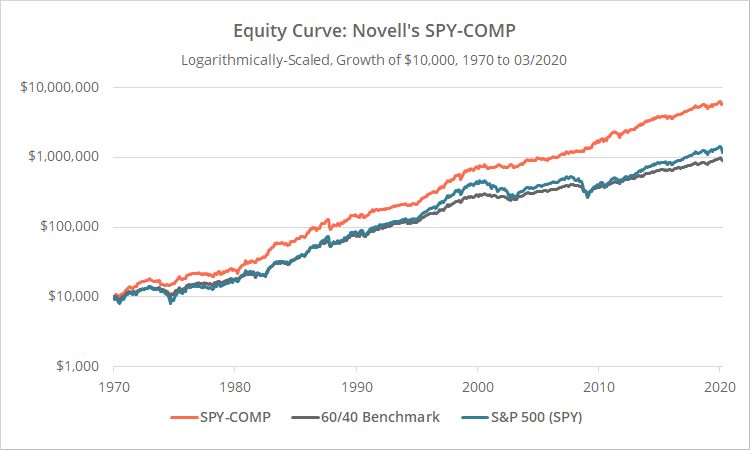
Logarithmically-scaled. Click for linearly-scaled results.
Note: Despite turning over the portfolio almost once per year on average, 91% of gains would have been long-term capital gains or dividends (based on today’s cap gains definition). Why? Like many trend-following strategies, losing trades have tended to be short-term and winners long-term. Read more. Members: See the Tax Analysis report.
We share a lot of members in common with Paul. His site has been knee-deep in the type of tactical asset allocation strategies that we cover for a long time, and we know quite a few of our members are chuffed to see his flagship model added.
In a first for Allocate Smartly, we will not be disclosing the specific rules for SPY-COMP. We’ve programmed them into our system, but they will be a black box to members. Members will see the same historical performance data and real-time signal they’re accustomed to, but will not know precisely how those results were generated.
We’re okay with that. We think the benefit of independent verification and having SPY-COMP on the platform outweighs any downside of being opaque.
Overview of strategy:
The basic premise of SPY-COMP and strategies like it is thus:
Trend-following based on asset price alone does a good job determining when to switch to defensive assets inside of recessions, but a poor job outside of recessions. Outside of recessions, any deviation from 100% long risk is often a drag on performance, making attempts to finesse positions via trend-following counterproductive. If we have a means to judge when the economy is entering/exiting a recessionary period, we’ll know when to turn trend-following on/off.
This type of approach has been particularly effective during the bull run since the 2008 Global Financial Crisis. Over the last 10+ years, every significant pullback (our current crisis possibly excluded) has quickly reversed course. These types of “headfakes” are trend-following’s bane. By deferring to the economic indicators first, these types of strategies stayed mostly long risk, and as a result have been some of the top performing on our site over this period.
SPY-COMP allocates 100% of the portfolio to a single asset at any given time: either US equities (represented by SPY) or US Treasuries (IEF).
To know when to switch between them, SPY-COMP monitors 6 different economic indicators. When no indicators are signaling recession, the strategy remains long SPY, regardless of what price is telling us. If any one of those indicators is signaling a potential recession then it defers to trend-following to confirm, either going long SPY if the trend in equities is up, or IEF if the trend is down.
Positions are executed at the close on the last trading day of the month and held until the following month. All economic data is lagged by 1-month due to delays in data reporting (learn more).
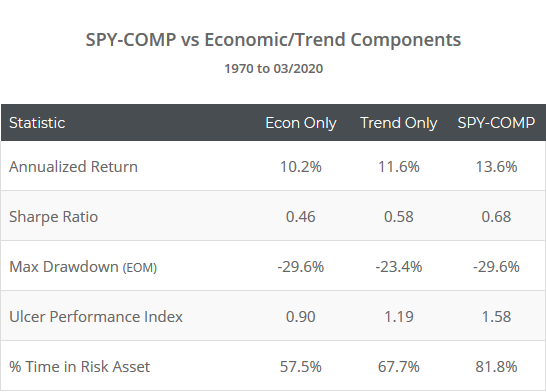
To demonstrate the effectiveness of this combined approach, below we’ve shown SPY-COMP, versus the economic and trend components alone. Note the greater % of time spent in the risk asset (SPY), leading to higher returns while maintaining roughly the same level of drawdown.
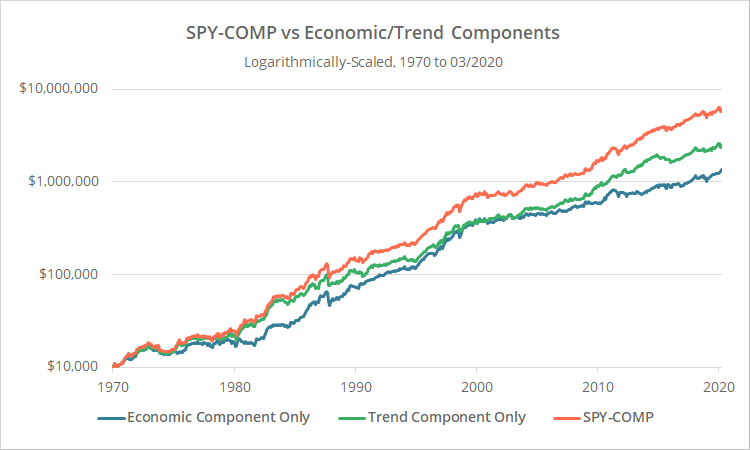
Logarithmically-scaled. Click for linearly-scaled results.
A bit of common sense:
SPY-COMP allocates 100% of the portfolio to a single asset at any given time, making it potentially a very risky/volatile strategy. As with all concentrated strategies, we highly recommend combining it with other strategies to diversify some of the short-term risk. This helps to tame the volatility that sometimes leads to short-term underperformance and scares investors out of positions. Combining strategies together like this is something our platform was specifically built to tackle.
Last month provided a good example of that. The strategy was long Treasuries entering March. That was obviously a great trade. But had the stars aligned a little differently and the economic and trend components not sniffed out weakness, it could have been 100% long risk into the void. The 1-month lag in economic data required by these types of strategies makes this even more likely. By combining strategies, we diversify the “specification risk” of any one particular strategy.
Our take on SPY-COMP versus similar “hybrid” strategies:
SPY-COMP is similar to Growth-Trend Timing (GTT) and a handful of other strategies that we track in that it marries economic data with trend-following. Where it differs is that it considers a broader array of economic indicators, all of which have been at least somewhat predictive on their own.
That inherently increases the possibility of overfitting versus a simpler model like GTT, but the trend component helps to alleviate that concern. Here’s what we mean:
If any 1 of the 6 economic indicators is signaling recession, the strategy defers to the trend component. That means any potential overfitting is going to push more trades to the trend component, not less. The trend component is a simple, tried-and-true approach with no bells and whistles. So if you’re a believer in good ol’ fashioned trend-following, then any potential overfitting is just pushing more trades to what you know works already.
So is SPY-COMP superior to those other similar “hybrid” strategies? We leave that to the discretion of members based on the results provided. Our only point is that in this instance the additional complexity of including so many economic data points is likely not the bright flashing warning light it normally would be.
Thank you to Paul Novell and the opportunity to put his flagship strategy to the test. For readers interested in all things asset allocation, we highly recommend following Paul’s Investing for a Living now.
New here?
We invite you to become a member for about a $1 a day, or take our platform for a test drive with a free limited membership. Put the industry’s best tactical asset allocation strategies to the test, combine them into your own custom portfolio, and follow them in near real-time. Not a DIY investor? There’s also a managed solution. Learn more about what we do.
A note about point-in-time versus revised economic data:
Economic data is often released at some initial value and then later revised, often multiple times. All of the historical results shown on this site are based on the historical economic data as it looks today. That raises the possibility that the historical signal shown today doesn’t match what would have been signaled in real-time. That’s a risk inherent in trading based on economic data.
Philosophical Economics did an excellent analysis of this issue for his Growth-Trend Timing strategies. In short, while it could lead to a different signal in any given month (sometimes for the worse, sometimes for the better), those differences tend to wash over time and have had little impact on long-term performance. Our previous analyses of some of the relevant strategies that we track concurs. All of these strategies include some element of price trend-following (which is unaffected by this data revision issue) that likely serves to keep signals somewhat in-line through any data revisions.
