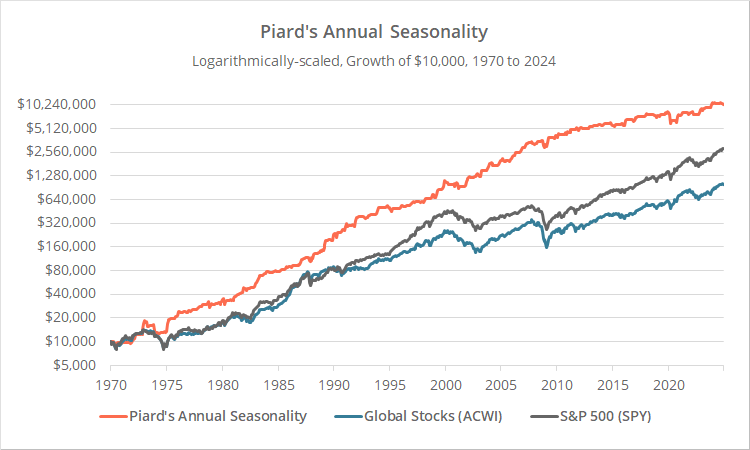
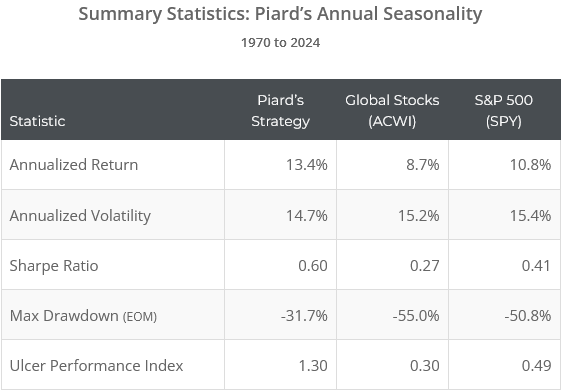
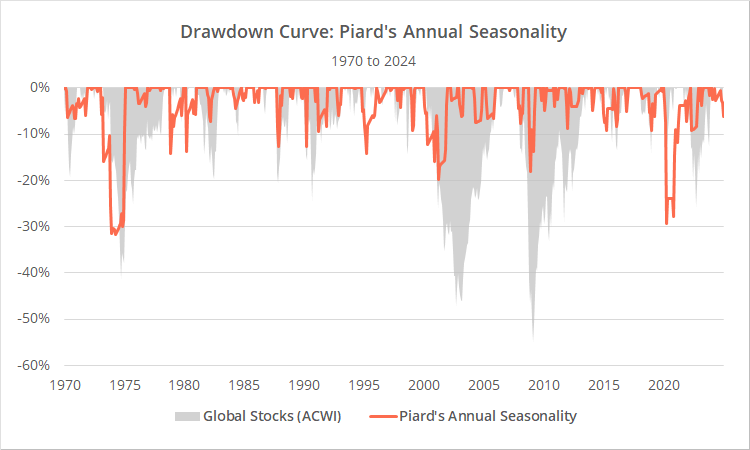
This is a test of two stock market seasonality strategies from Fred Piard’s book Quantitative Investing: Strategies to Exploit Stock Market Anomalies for All Investors.
Strategy results from 1970 follow. Results are net of transaction costs – see backtest assumptions. Learn about what we do and follow 90+ asset allocation strategies like this one in near real-time.

Logarithmically-scaled. Click for linearly-scaled results.
Strategy rules tested:
We are combining two of Piard’s annual seasonality strategies into one, with half of the portfolio allocated to each. Both are similar to the classic Sell in May aka “Halloween Indicator”, with a country-specific twist.
- Allocate 25% of the portfolio to Singapore stocks (EWS) and 25% to Brazil stocks (EWZ) from November to April.
- Allocate 50% of the portfolio to Germany stocks (EWG) from October to December and March to April.
- Any unallocated portion of the portfolio is instead placed in cash. Assume the portfolio is rebalanced monthly, regardless of whether there is a change in position.
To stay in line with other strategies we track, all positions are assumed to be executed at the close on the last trading day of the month. For example, if holding an ETF in November, the buy order is placed at the close on the last trading day of October.
This differs from Piard’s test which assumed orders were executed at the open on the first day of the month. Given how long the strategy holds positions, we would not expect a significant long-term difference between the two approaches.
Piard provided an optional rule to place unallocated funds in long-term US Treasuries (TLT) instead of cash. We are not proponents of any strategy that blindly dumps a portfolio to long duration bonds when risk off (read more and more), so we’ve opted for cash when out of the market.
Our take on annual seasonality:
We’re not going to provide our own analysis of annual seasonality in these specific countries. This subject has been done to death.
Piard’s strategy is based on a pair of classic papers demonstrating the presence of annual seasonality going back more than 300 years, and that seasonality has been strongest in these 3 particular markets. Read more and more.
Do we think that there is value in annual seasonality relative to a 100% buy & hold allocation to stocks? Probably, over a very long investment horizon, in a tax advantaged account. There’s a multi-century history of outperformance, across many global markets.
Do we think that these specific markets are the best way to express that rather than a global index like ACWI or the US? Possibly, but it adds a lot of uncertainty. There is implicitly an added helping of overfitting when selecting specific smaller markets to capture annual seasonality.
Trend-following and momentum (which most of the strategies we track employ) also has a multi-century track record but has performed much more consistently. Read more, more and more.
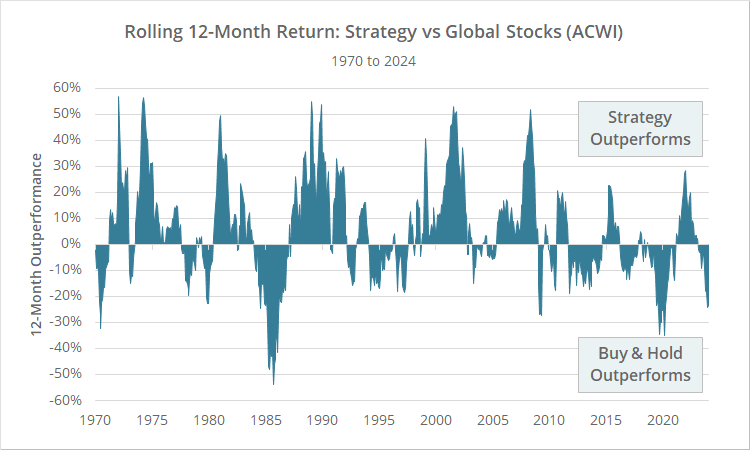
Annual seasonality has been a very “hero or zero” approach. In years when it works well (like 2022) it can work very well. In years when it works poorly (like 2024) it can be a real dog.
To illustrate, below we’ve shown the rolling 12-month return of Piard’s strategy versus buying and holding ACWI (global stocks). Note the frequency with which the strategy has out/underperformed in excess of 20%.
It’s easy to look at long-term performance from 30,000 feet and say, “yeah, I could trade that”. But experienced investors know that it’s an entirely different thing to trade a strategy month in and month out. Short-term underperformance must be held to tolerable levels because it leads investors to change their best laid investment plans, usually at the worst possible moment.
Couple that with how infrequently the strategy trades. It will be difficult to know if/when the strategy has ceased to work. It would take multiple decades to say with any certainty whether any future underperformance was statistically significant.
As a standalone trading strategy, we don’t think annual seasonality is the wisest approach. At the most, it should be a small component of a diversified combination of strategies (what we refer to as Model Portfolios).
Portfolio Optimizer:
Piard’s strategy exhibits very low correlation to other strategies we track. That low correlation means that a small allocation to the strategy is showing up in many of the Optimized Portfolios.
We are not totally averse to that – there’s value in combining diverse investment approaches – but we would recommend investors do a gut check to see if they are comfortable with the issues raised:
- The frequent short-term underperformance inherent to annual seasonality strategies.
- The potential overfitting risk of applying annual seasonality to these specific small markets
- How infrequently the strategy trades and how difficult it will be to know if it stops working.
If investors have a very long investment horizon and are comfortable with those potential concerns, go to town. If not, members can remove the strategy from the optimizations.
An important note for investors trading in taxable accounts:
Obviously, this strategy is very tax inefficient for US investors because positions are always closed within a year. See our full Tax Analysis.
Further, because no other strategy that we track trades any of the 3 ETFs traded by this strategy, there is no potential tax benefit from combining strategies into Model Portfolios.
Outro:
A big thank you to Fred Piard for sharing these and other strategies in his book. Piard lays out his strategies clearly without a lot of unnecessary fluff. That’s great for nerds like us who just want the nuts & bolts.
New here?
We invite you to become a member for about a $1 a day, or take our platform for a test drive with a free membership. Put the industry’s best Tactical Asset Allocation strategies to the test, combine them into your own custom portfolio, and follow them in real-time. Learn more about what we do.
* * *
Calculation note: Results do not include Brazil equities (EWZ) prior to 1988 due to a lack of accurate asset class data. Prior to this date, we allocate the portion of the portfolio that is usually split between EWS and EWZ entirely to EWS.


