This is a test of the “Golden Butterfly”, the homegrown buy & hold strategy from PortfolioCharts.com. PortfolioCharts is to buy & hold what AllocateSmartly is to tactical asset allocation, an independent and unbiased catalog of strategy performance, so when they put their stamp of approval on a portfolio, it deserves consideration.
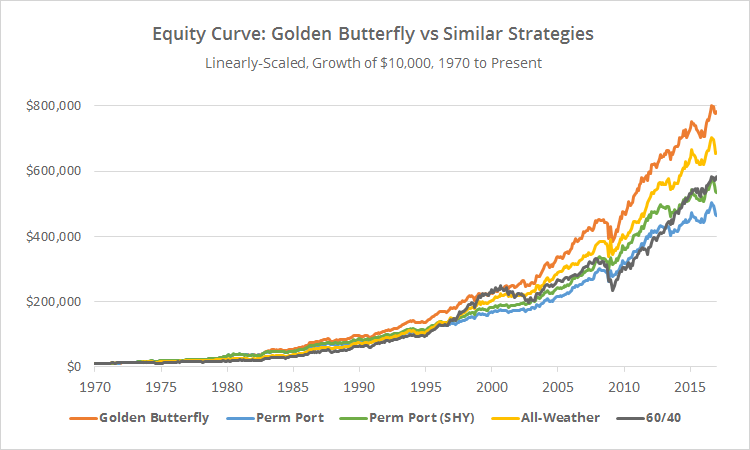
This strategy is similar in concept to Browne’s Permanent Portfolio and Dalio’s All-Weather. Results for all of these models since 1970, net of transaction costs, follow. Read more about our backtests or let AllocateSmartly help you follow this strategy in near real-time.

Linearly-scaled. Click for logarithmically-scaled chart.

Note: We’ve shown two versions of the Permanent Portfolio, one using cash and the other using short-term US Treasuries (SHY). More on this in a moment.
About these strategies:
All of these strategies are built to capitalize on four possible economic conditions, or “seasons”. The four seasons and the assets best positioned to succeed in each are:
- Prosperity: Equities
- Recession: Short-term Treasuries and cash
- Inflation: Gold and commodities
- Deflation: Long-term treasuries
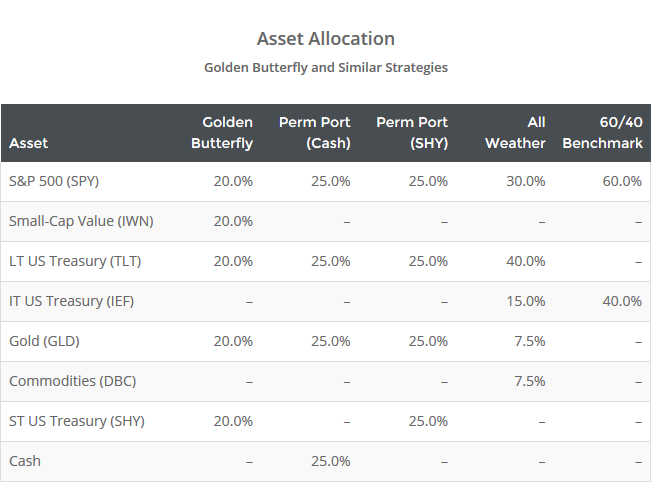
Where these strategies differ is in the asset classes used to represent each of the four seasons, and the percentage allocated to each. Note: in addition to our normal backtest assumptions, all portfolios are assumed to be rebalanced annually.
The Permanent Portfolio takes the most straight-forward approach, dividing the portfolio equally among a single asset for each season. Note: the Permanent Portfolio is generally shown using cash as the short duration “recession” instrument, and that’s how we track it on this site. We’ve also shown an additional version of the Permanent Portfolio here instead using SHY (like the Golden Butterfly) in order to capture any historical advantage of SHY versus cash.
The All-Weather Portfolio introduces commodities, and more importantly, uses a rough risk-parity weighing that results in a significantly larger allocation to longer duration Treasuries. Note: we track the version of All-Weather published in Tony Robbins’ Money: Master the Game.
The Golden Butterfly chooses to instead overweight “prosperity” (by doubling up on equity assets) based on the fact that it’s by far the most common of the four seasons. Also, it adds exposure to the value premium with the choice of US small cap value.
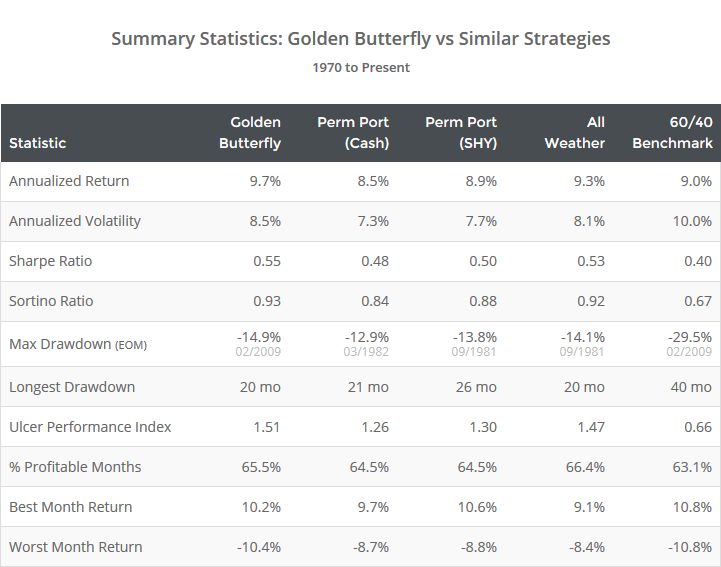
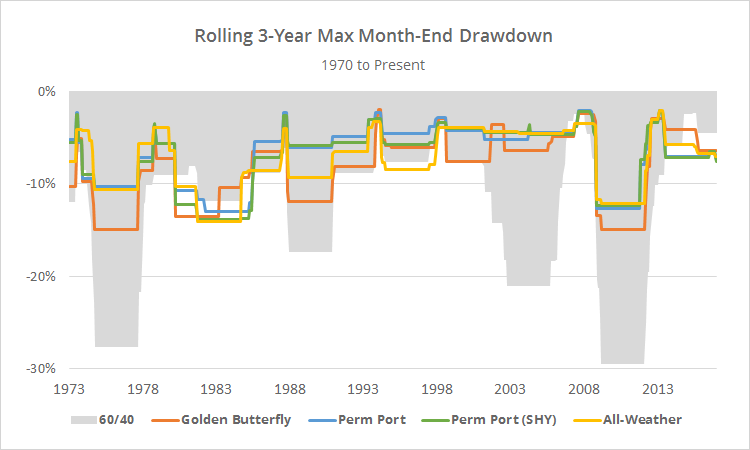
As should be clear from the summary stats above, the primary advantage of all of these strategies has been in managing losses, as opposed to generating outsized returns. To illustrate, below I’ve plotted the rolling 3-year max month-end drawdown of all strategies versus the 60/40 benchmark.
So which “four season” portfolio is the best?
Some observations:
- With its large exposure to long and intermediate-term US Treasuries, the All-Weather Portfolio will likely face the strongest headwinds if the future brings an extended period of rising interest rates (read more). Regardless of historical performance, I would be most wary of this model.
- Both the Golden Butterfly and the Permanent Portfolio (Cash) have total exposure to rising rates much closer to the neighborhood of the 60/40 portfolio. In the case of the Golden Butterfly, this could be further reduced by replacing allocation to long-term US Treasuries (TLT) with intermediate-term Treasuries (IEF) with little impact on historical performance (9.5% annualized return vs 9.7%, and a Sharpe/UPI of 0.55/1.46 vs 0.55/1.51).
- The Golden Butterfly’s tilt towards “prosperity” makes sense as that’s been by far the most common of the seasons. As PortfolioCharts discusses, the advantage of adding exposure to value (via IWN) is debatable, but results would have been similar trading a small cap balanced fund (IWM) instead (9.5% annualized return vs 9.7%, and a Sharpe/UPI of 0.51/1.27 vs 0.55/1.51).
- I am personally not a fan of the large allocation to gold that all of these strategies share. That distaste has nothing to do with gold’s efficacy (or lack thereof) as a hedge against inflation. It has everything to do with gold’s tendency towards long multi-decade periods of flat/negative returns. Having said that, I understand that its primary advantage in this case is as an uncorrelated return stream.
I think both the Golden Butterfly and the Permanent Portfolio are reasonable choices for the buy & hold portion of a portfolio. Given a long enough time horizon, I would lean towards the Golden Butterfly because of its larger allocation to equities. Investors concerned with a future of rising interest rates, might consider replacing the model’s long-term US Treasury exposure (TLT) with a shorter duration instrument like IEF.
I appreciate PortfolioCharts.com giving us the opportunity to test this model. For readers interested in an empirically-minded view of the most popular buy & hold allocations, I highly recommend visiting PortfolioCharts now.
We invite you to become a member for less than $1 a day to track these and other excellent models in near real-time, or take our platform for a test drive with a free limited membership. Have questions? Learn more about what we do, check out our FAQs or contact us.
End notes:
Prior to 02/1979, IWM (US small caps) has been used in place of IWN (US small cap value) due to a lack of accurate historical data.
A note on cash and short-term Treasuries: As long-time readers have heard me discuss in the past, when replicating strategies on this site we use “cash” (equal to the 3-month UST rate) in place of short-duration instruments like SHY. We feel it’s a more appropriate choice in today’s environment of low interest rates given transaction costs and how frequently many of the strategies that we track trade. However, because the Golden Butterfly is a buy & hold strategy, we’ve made an exception and used SHY in this test as the strategy’s author originally intended.

