New to Tactical Asset Allocation? Learn more: What is TAA?
There are two hard costs that investors must consider when comparing a tactical asset allocation strategy to conventional buy & hold: (1) increased tax liability (if trading in a taxable account), and (2) increased trading costs (transaction costs and slippage). Because we track so many published models (50 and counting) we’re in a unique position to analyze the cost efficiency of TAA as a whole.
We’ve discussed TAA and taxes in the past and we model each strategy’s historical tax efficiency for members. In a nutshell: TAA as a whole has been relatively tax efficient, but the particular strategy you choose matters a lot. Individual strategies range from very to not remotely tax efficient.
In this post we focus on the second hard cost: transaction costs and slippage, and its drag on returns for each of the strategies that we track (1). Of course, we can’t know the costs associated with your specific trading setup, so we make a fairly generous assumption: 0.1% of the trade value (0.2% per round-trip) (2). Given the types of assets that we cover (large, liquid ETFs), that should be more than sufficient for traders with a reasonably large account and a reasonably cost-effective broker.
Important: All of the results shown on our site are already net of this trading cost assumption.
To reiterate, the results that we show on this site are already net of the annual % drag shown here.
The Results
Like we see with tax efficiency, there’s a wide range of “trading cost efficiency”, ranging from 0.03% per year for the 60/40 benchmark to 1.38% for the most active strategy that we track. The median result is 0.43%.
Given enough time, those are not insignificant numbers. A dollar compounded at 10% for 30 years becomes $16.45. Apply a 0.43% drag per year and that dollar becomes $14.51, a 12% reduction in terminal wealth. Apply a 1.38% drag per year, and that dollar becomes just $10.95, a 33% reduction.
Two takeaways:
- The first is pretty simple, and applicable to all styles of investing: strive to reduce trading costs. If we can do that, then some of these strategies would have seen a significant bump in return from the results we show on our site.
- And second, when viewing a backtest for a TAA strategy (or any strategy for that matter) it’s important to understand whether some sort of reasonable assumption about trading costs has been included. Because if it hasn’t, it could have a significant impact on results.
Is there value in generating more trading costs?
Do TAA strategies with higher portfolio turnover (i.e. those that generate more trading costs) outperform slower moving alternatives? Is there value net of the additional costs?
To answer that, below below we’ve plotted the annual % drag from trading costs (x-axis) versus each strategy’s gross annual return (chart #1), net annual return (#2), and for good measure, net Sharpe Ratio (#3).
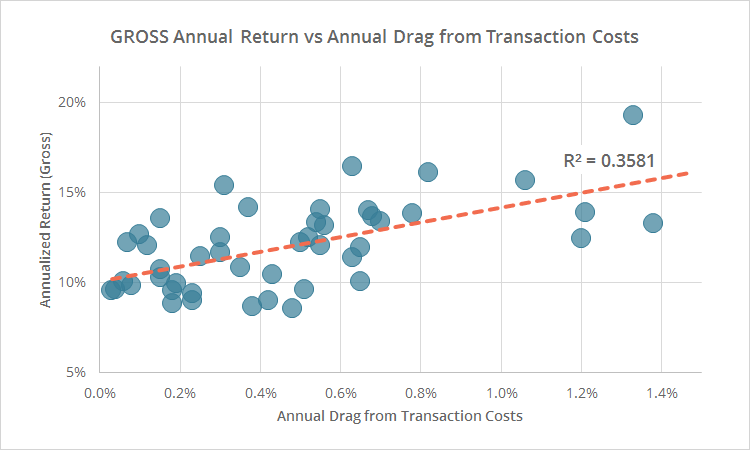
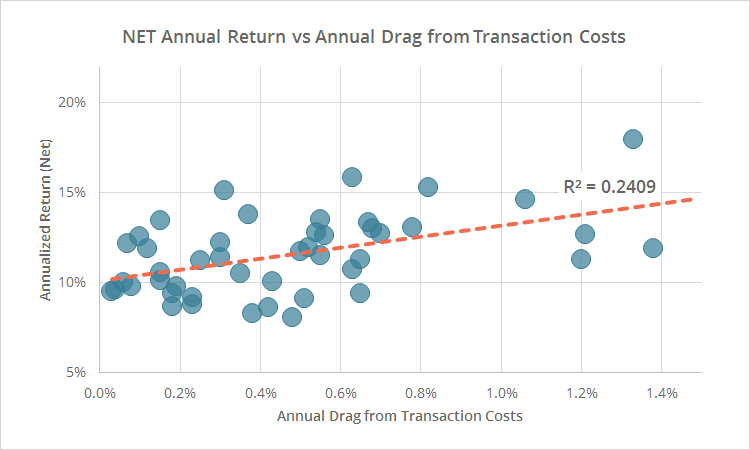
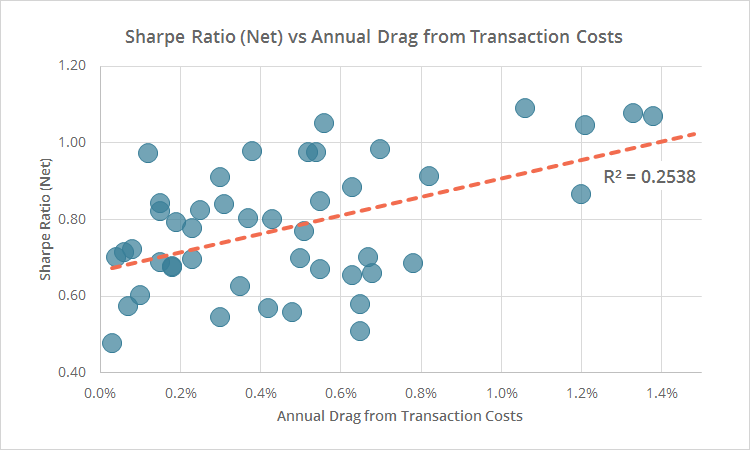
While it’s true that the least cost efficient strategies tend to be high flyers, especially in terms of gross returns (chart #1), much of that advantage disappears when viewed net of costs (chart #2) or relative to volatility exhibited (chart #3). We don’t see conclusive evidence that higher (or lower) portfolio turnover in and of itself has spelled better net returns for TAA.
Put another way, if you’re okay with higher turnover and/or can significantly reduce trading costs, there are lots of hyper-active strategies that have put up strong numbers. If you want to minimize turnover, there are lots of less active strategies that have also put up strong numbers too.
Member tip: Estimating the annual % drag from trading costs
You can estimate the annual % drag from trading costs for any strategy that we track (reminder: the results shown on our site are already net of these trading costs). Simply multiply the strategy’s annual turnover by 0.2%. That’s a less accurate estimate than what we’ve shown here for a number of reasons, but it will get you in the ball park.
New here?
We invite you to become a member for about a $1 a day, or take our platform for a test drive with a free limited membership. Put the industry’s best tactical asset allocation strategies to the test, combine them into your own custom portfolio, and then track them in near real-time. Have questions? Learn more about what we do, check out our FAQs or contact us.

Calculation notes: (1) We track four static, buy and hold strategies in addition to the 60/40. They have not been included in this analysis. (2) Our site-wide trading cost assumption does not apply to buying/selling cash.