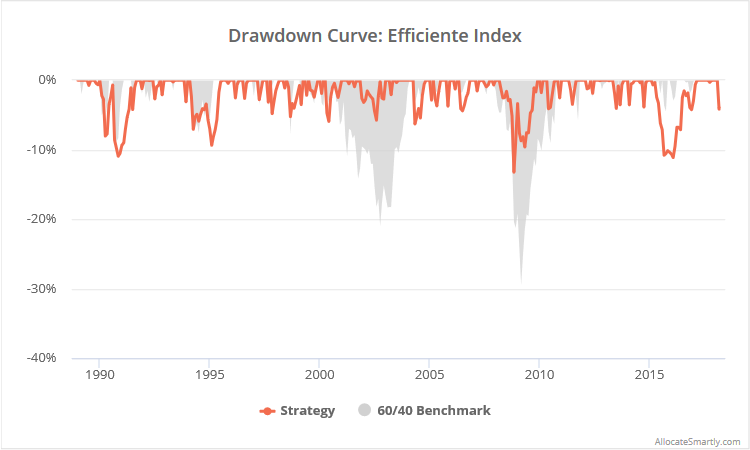
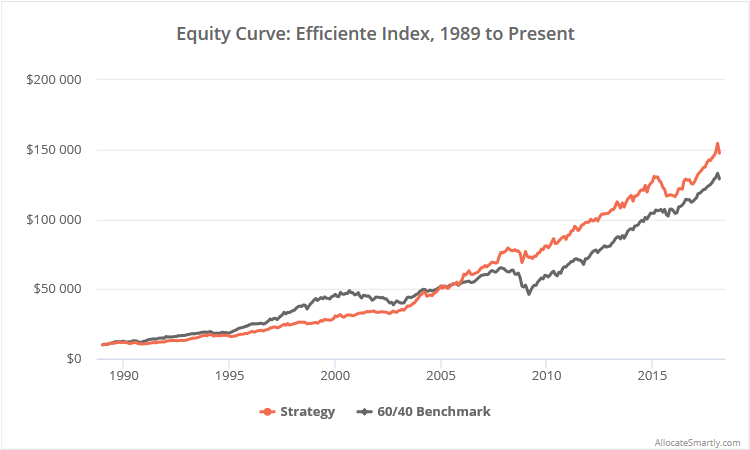
This test is based on the Efficiente Index from JP Morgan. A variation of this strategy is available via the ETF EFFE. The strategy uses traditional mean-variance optimization (aka the “Efficient Frontier”) to trade a broad basket of asset classes, but it’s actually a momentum strategy in disguise. The strategy hasn’t generated huge returns, but it has had success managing losses, reducing peak drawdowns in the 60/40 benchmark by more than half.
Results from 1989 to the present, net of transaction costs, follow. Read more about our backtests or let AllocateSmartly help you follow 40+ TAA strategies in near real-time.
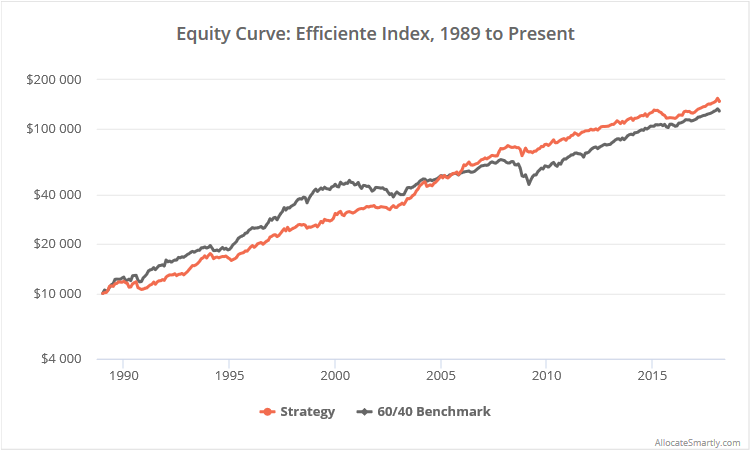
Logarithmically-scaled. Click for linearly-scaled chart.
A momentum strategy in disguise:
The strategy trades monthly, using mean-variance optimization (MVO) to determine asset weights. MVO requires three inputs: asset return, plus volatility and correlation (together: covariance) to find an “optimal portfolio”. In traditional portfolio analysis, these inputs are assumed to be static over long periods of time. That assumption is the fatal flaw of traditional MVO, as all three inputs (especially returns) are moving targets.
This strategy combats that flaw by using a very short lookback of 6 months. That essentially makes it a momentum strategy in disguise, as assets performing more strongly in the very recent past will tend to have the largest allocations. This MVO + short lookback approach is the same one taken by two other strategies that we track: Classical Asset Allocation (the top performing TAA strategy of 2017) and our spin on a Max Sharpe portfolio.
Strategy rules tested:
Note that multiple versions of this strategy have been published, each with slight differences. We’ve tried to capture the best mix of them.
- At the close on the last trading day of the month, use MVO to find the portfolio with the highest expected return:
- Based on the previous 6-months of asset data (126-days)
- Long-only, without leverage.
- Annualized realized volatility <= 10%
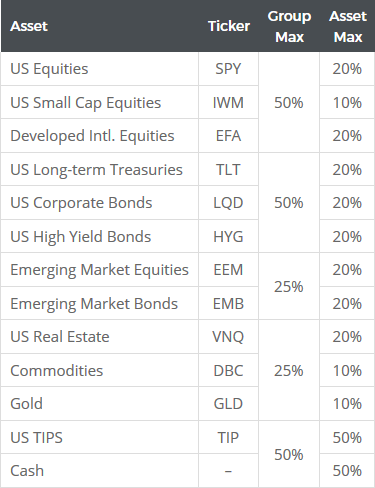
- Subject to both the asset and group constraints shown below.
- All trades are executed at the close. Hold positions until the final trading day of the following month. Rebalance the entire portfolio monthly, regardless of whether there is a change in position.
A shout out to our geeks: I realize that to the uninitiated this seems like a reasonably straight-forward strategy (so few rules!). But calculating a target volatility portfolio with both asset and group constraints is a bit of an analytical lift, especially when you have to do it in near real-time like we do in the members area. Kudos to our quant team.
What we like about this strategy:
As a concept, we really like the MVO + short lookback approach taken by the Efficiente Index.
At its core it’s a momentum strategy, an effective approach to asset allocation that has worked for essentially as long as financial markets have existed. At the same time, it takes advantage of the benefits of considering volatility and correlation when determining asset weights (rewarding less volatile and less positively correlated assets). Both tend to be more stable and easier to predict than returns.
We also like the use of constraints to limit exposure to groups of assets (equities for example). Because of the short lookback, these types of strategies tend to become very concentrated in particular types of assets at any given moment. The use of group constraints enforces some degree of diversification.
We would like to see a bit more nuanced approach to measuring momentum than simply 6-month returns. A good example of such an approach can be seen in the Classical Asset Allocation strategy, which measures momentum over multiple momentum friendly lookbacks from 1 to 12 months, with extra weight given to more recent months.
A nasty drawdown in 2015?
This is a good opportunity to illustrate a problem with linearly-scaled (as opposed to logarithmically-scaled) charts. We always provide both, and we prefer log-scale in our own analysis, but we usually show linearly-scaled charts by default as they’re more familiar to investors.
One problem with linearly-scaled charts is that, assuming that a strategy’s equity curve is growing over time, drawdowns (losses) of the same % magnitude will look much worse in the recent past than in the distant past. That’s due to the impact of compounding returns. Here’s the same equity curve shown in both linear (left) and logarithmic (right) scale. Click to zoom.
The linearly-scaled chart makes it appear as if the strategy suffered a nasty drawdown in 2015 way beyond anything the strategy had seen before. But the log-scaled chart (coupled with the drawdown curve previously shown) makes it clear that the nasty 2015 drawdown was well in-line with what the strategy has experienced in the past. Nothing to see here.
What is much more troubling is that the strategy suffered that 2015 drawdown without similar losses in equities/treasuries (i.e. the benchmark). We saw this 2015 face plant across a number of the momentum-oriented TAA strategies that we track.
We’ve had this discussion before, but it’s due a refresher:
There were two periods, in late-2015 and early-2016, when the markets suffered sharp losses. Generally-speaking, TAA positioned itself defensively by rotating into less risky assets. Historically this has been the smart play, but in both of these instances the market immediately rebounded. That means TAA was offensive on the way down and defensive on the way back up, and as a whole, underperformed.
You can see those two brief periods in the chart below showing the aggregate asset allocation of all of the strategies that we track. Note the two blue defensive blips towards the right of the chart:
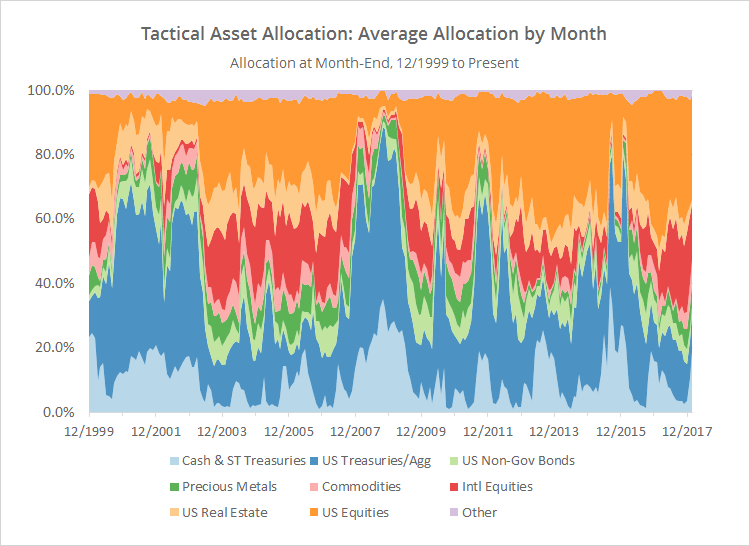
Put another way, this strategy along with a number of other TAA strategies that we track got “head faked”. It happens. TAA tries to strike a balance between being “fast” enough to adjust to changes in the market, while being “slow” enough to ignore this type of noise. The only important consideration is whether it’s able to do that successfully over the long-term, which (the 2015 face plant aside) it has with flying colors.
We invite you to become a member for about a $1 a day, or take our platform for a test drive with a free limited membership. Put the industry’s best tactical asset allocation strategies to the test, combine them into your own custom portfolio, and then track them in near real-time. Have questions? Learn more about what we do, check out our FAQs or contact us.
End notes:
- Goldman Sachs also provides a model that is nearly identical model to the Efficiente Index: The GS Momentum Builder Multi-Asset Index.
- Unlike most of the strategies that we test, the description of this one is a little light on details. While we’re confident that we’ve accurately captured the meat of the model, we might be a little off at the periphery.
- There are two places where we know we’ve deviated from the original strategy. The original strategy assumes allocation to each asset is always an integral multiple of 5%. We’ve ignored that requirement (because we assume the strategy is just one component of a member’s custom model portfolio), but we’ve added an additional requirement that any allocation less than 2% is dropped and redistributed proportionally to the remaining assets in the portfolio.

