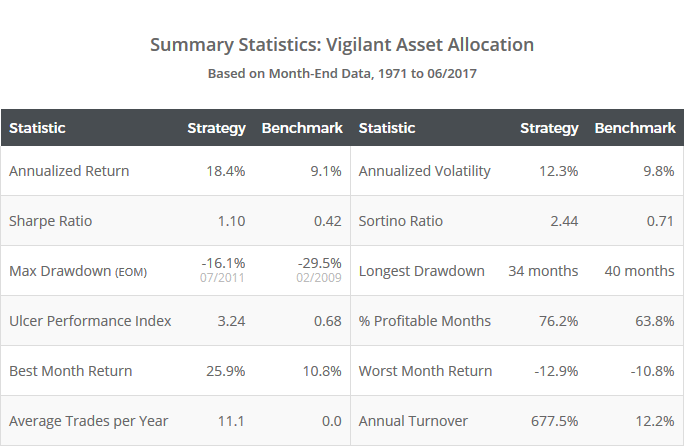
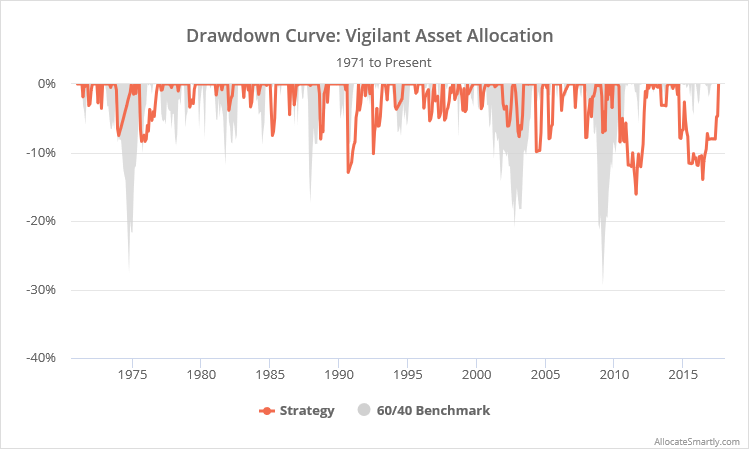
This is a test of the “Vigilant Asset Allocation” (VAA) strategy from the recently published paper: Breadth Momentum and Vigilant Asset Allocation, by Dr. Wouter Keller and JW Keuning. This is an aggressive momentum trading model, similar in spirit to Keller and Keuning’s popular Protective Asset Allocation strategy. Results versus the 60/40 benchmark from 1971 to the present, net of transaction costs, follow.
Read more about our backtests or let AllocateSmartly help you follow this strategy in near real-time.

Logarithmically-scaled. Click for linearly-scaled chart.
Note: There are multiple versions of the strategy included in this paper. We tested VAA-G4 (T=1/B=1) as recommended by the authors. Other versions use different rules than what we’ve described below.
About Vigilant Asset Allocation (VAA):
VAA is an aggressive momentum strategy. The version we tested allocates 100% of the portfolio each month to a single asset from a small basket of either offensive or defensive assets.
We track a number of momentum strategies on this site, but unlike most of the others that we track, VAA’s approach to measuring momentum is heavily biased towards very recent months. This makes VAA quicker to respond to market changes, but also leads to high portfolio turnover.
VAA also makes use of what the authors call “breadth momentum”. In a conventional TAA strategy, when the model sells a given risk asset, that asset’s portion of the portfolio is placed in some defensive asset. In the case of breadth momentum, the allocation to defensive assets is determined by the entire universe of risk assets. Put another way, the strategy uses market breadth to determine how much of the portfolio to allocate defensively.
Strategy rules tested:
- The model includes both an offensive and defensive universe:
- Offensive: US equities (represented by SPY), international equities (EFA), emerging market equities (EEM) and US aggregate bonds (AGG). More on the seemingly odd inclusion of AGG as an offensive asset in a moment.
- Defensive: US corporate bonds (LQD), US intermediate-term Treasuries (IEF) and US short-term Treasuries (SHY).
-
For all assets, at the close on the last trading day of the month, calculate a “momentum score” based on month-end data as follows:(12 * (p0 / p1 – 1)) + (4 * (p0 / p3 – 1)) + (2 * (p0 / p6 – 1)) + (p0 / p12 – 1)Where p0 = the asset price at today’s close, p1 = the asset price at the close of the previous month, etc.
Note how this approach overweights more recent months. Doing the math, the most recent 1-month change (p0/p1 – 1) determines 40% of the momentum score, while the most distant month (p11/p12 – 1) determines just ~2%.
- If all four of the offensive assets exhibit positive momentum scores, select the offensive asset with the highest score and allocate 100% of the portfolio to that asset at the close. Note the use of both absolute and relative momentum here, an idea popularized by Gary Antonacci as “Dual Momentum”. Why is that important? Historically, absolute momentum has done well minimizing losses, while relative momentum has helped in generating outsized returns.
- If any of the four offensive assets exhibit negative momentum scores, select the defensive asset (LQD, IEF or SHY) with the highest score (regardless of whether the score is > 0) and allocate 100% of the portfolio to that asset at the close. As we do throughout this site, trades in SHY are assumed to be placed in cash, as it’s more relevant to today’s market given SHY’s low yields coupled with the impact of transaction costs and how frequently this strategy trades.
- Hold the position until the final trading day of the following month.
A word of caution
This strategy only holds one asset at any given time, which historically has resulted in extremely high returns, but could also lead to extremely high portfolio volatility and potential for loss.
There are different schools of thoughts on this. As we discussed in our test of Antonacci’s Composite Dual Momentum, some see concentrated portfolios as a good thing because diversification inherently dilutes your best bets. As we also discussed in that post, we take a different view. We see the function of diversification (between both assets and between strategies) not just being the stated goal of reducing risk through less than perfectly correlated return streams, but as insurance against the unknown; an acknowledgement that we don’t know what we don’t know.
Whichever side of the fence you fall on, our members have the ability to combine multiple strategies into custom portfolios, so even risk-averse investors can find value in concentrated portfolios like this as components of a broader strategy.
Something strange that isn’t that strange after all
On our first read of this paper, the inclusion of US aggregate bonds (AGG) as an offensive assets struck us as odd. Agg. bonds are the antithesis of a risk asset, but strategy results deteriorated significantly when they weren’t included (ex. Sharpe Ratio fell from 1.10 to 0.83, and max drawdown from -16.1% to -25.2%). We believe that TAA models should, generally-speaking, “make sense”, and having this ill-fitted asset with such an outsized impact on returns smelled like potential overfitting.
AGG was held in less than 1% of months in our test, so AGG wasn’t a return driver. That makes sense. If all four offensive assets (SPY, EFA, EEM and AGG) have positive momentum, it’s highly unlikely that AGG will be the strongest of the bunch, simply due to its non-volatile nature. In this case, the role of AGG has been as a spoiler, causing the entire portfolio to move to a defensive asset, even if all of the true risk assets (SPY, EFA and EEM) are exhibiting positive momentum. Negative momentum in AGG alone can ruin the fun.
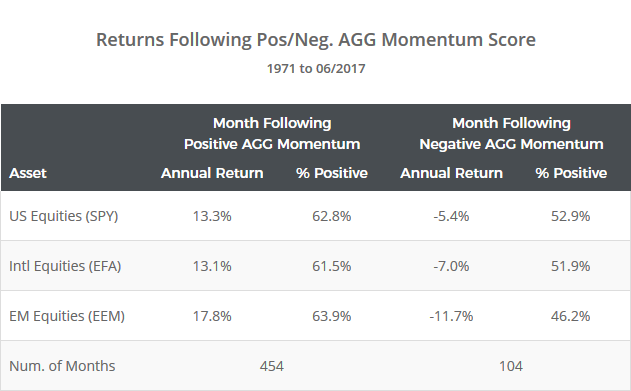
So the key question is, is weakness in AGG actually predictive of next-month weakness in SPY, EFA and EEM? Below we’ve stripped out all of the other strategy rules to show how these three risk assets have performed in the month following a positive vs negative AGG momentum score.
As the numbers above show, SPY, EFA and EEM have all performed poorly following a negative AGG momentum score. The effect was consistent over our entire sample. The effect could also be seen using other similar instruments (like SHY) in place of AGG. We have relatively few months to consider (104), but there appears to be evidence that the strategy’s inclusion of AGG is not that strange after all.
One last thought
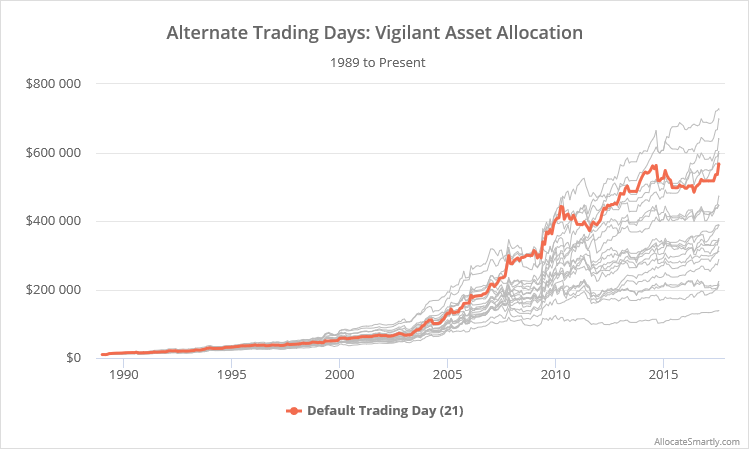
Because this strategy allocates the entire portfolio to a single asset, and because the “fast” momentum measurement changes positions so frequently, this strategy is especially susceptible to what Newfound Research [dead link] has dubbed “timing luck”. Trading on the last day of the month versus say the day prior or the day after will often result in radically different results.
To illustrate, below we’ve tested the strategy trading on days other than the last day of the month since 1989, using the method outlined here. This approach preserves the spirit of the strategy, even when trading on alternate days, and is available to members for all strategies that we track. The orange line represents trading on the last day of the month and the grey lines on alternate days. Note the wide disparity in results.

Linearly-scaled. Click for logarithmically-scaled chart.
More than most strategies that we track, the specific day that an investor chose to trade has mattered…a lot. We’ll be rolling out “portfolio tranching” in the coming weeks to help alleviate situations like this where “timing luck” is a particularly big factor. Members will be able to tranche a strategy, trading a portion of the portfolio on different days of the month, to achieve a smoother equity curve that is less prone to timing luck risk. For a discussion of portfolio tranching, see this excellent post [dead link] from Newfound Research.
Thank you to Dr. Wouter Keller and JW Keuning for their fine work and the opportunity to put this strategy to the test. These are two important minds in tactical asset allocation, and we highly recommend that you follow them now.
We invite you to become a member for less than $1 a day, or take our platform for a test drive with a free limited membership. Members can track the industry’s best tactical asset allocation strategies in near real-time, and combine them into custom portfolios. Have questions? Learn more about what we do, check out our FAQs or contact us.


