This is a follow up to a strategy we’ve covered previously: Accelerating Dual Momentum (ADM) from EngineeredPortfolio.com. See our first test of ADM, which includes a description of the strategy rules and our own analysis of the strategy.
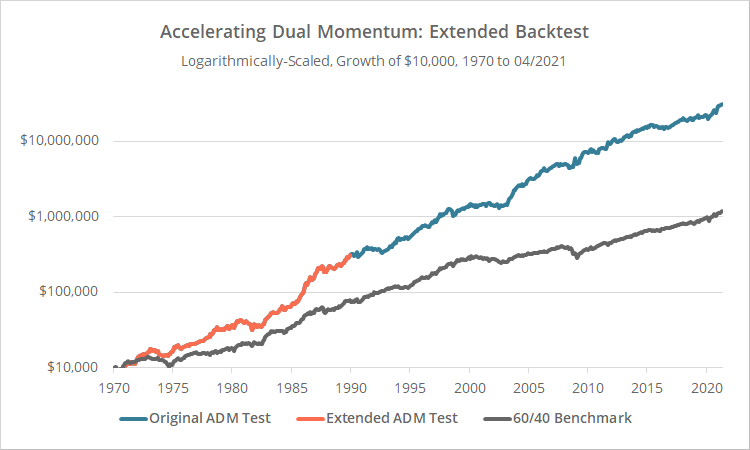
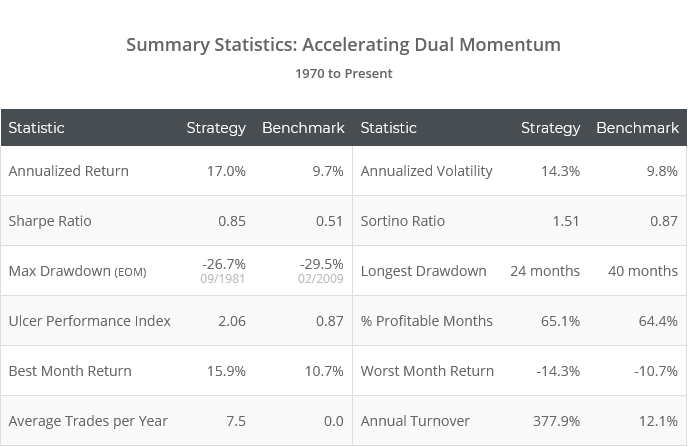
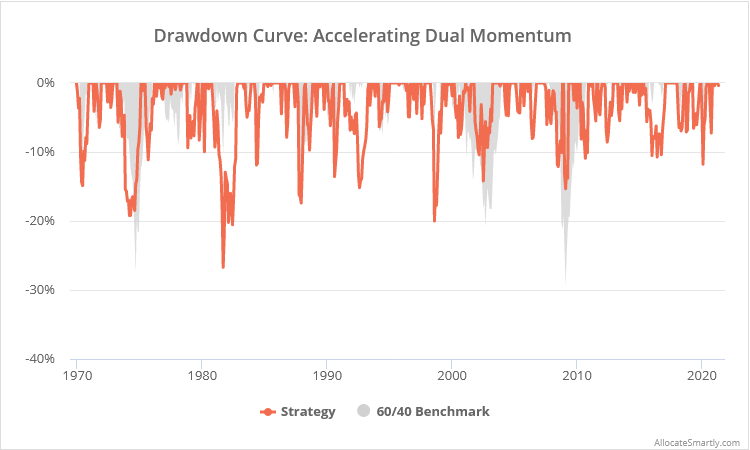
Here we’ve extended our test by 20 years to include a less effective era for this strategy. Results from 1970 net of transaction costs follow. Read more about our backtests or let Allocate Smartly help you follow this strategy in near real-time.
We’ve also modified the official test in our members area. This will have a knock-on effect on all supporting data, most notably: Safe Withdrawal Rates. More on this in a moment.
Why we revised the results on our platform:
We track strategies as closely to the author’s original intent as possible within some simple, common-sense standards (read more and more). We also start our tests as early as possible, based on the availability of high-quality asset class data.
ADM as originally designed makes heavy use of a rarely used asset class: Small Cap International Stocks (represented by the ETF SCZ). Quality data for that asset class doesn’t exist prior to 1989, and as a result, our original test was much shorter than most on our platform.
That’s a problem. ADM is a popular high-performing strategy with our members (rightfully so). As a result, we need to hold it to a higher standard and present a more “adversarial” test.
Sometimes our tests are shorter because of some hard limitation in the required data, such as the economic data required in our recent test of Risk Premium Value. In ADM’s case though, we can substitute a reasonably close alternative for SCZ in those first two decades, while still providing a good estimate of performance. So, for the years prior to 1990, we replace SCZ with its large-cap alternative (represented by EFA).
A big change to Withdrawal Rates:
We model 20, 30 and 40 year Safe (SWR) and Perpetual (PWR) Withdrawal Rates for all of the strategies on our platform. Members should expect to see a significant change to the withdrawal rates for ADM.
SWR measures the max amount that could have been withdrawn annually from a portfolio each year in retirement without running out of the money over the worst retirement period. It’s the source of the well-known “4% rule” common in financial planning. PWR is a more conservative measure. Rather than the goal being to not run out of money, the goal is to preserve the entire initial inflation-adjusted portfolio. Read more.
Because SWR and PWR are based on the worst retirement period, having more data to consider can only lower the rate, never increase it. That means a longer backtest makes for a more conservative (and likely more accurate) estimate.
Prior to adding this additional data to our test, ADM showed the highest SWR and PWR on our entire platform by a mile (9.0% and 8.8% withdrawal annually over 30-years). That felt a little egregious, but it was a byproduct of being a high performing strategy with such a short backtest.
With this additional data, ADM drops to a more reasonable 6.6% and 6.3%. That’s much more inline with what we’d expect from similarly performing strategies (but still much higher than what one could expect from conventional buy & hold).
Members: View the Withdrawal Rate Report.
New here?
We invite you to become a member for about a $1 a day, or take our platform for a test drive with a free limited membership. Put the industry’s best tactical asset allocation strategies to the test, combine them into your own custom portfolio, and follow them in near real-time. Not a DIY investor? There’s also a managed solution. Learn more about what we do.


