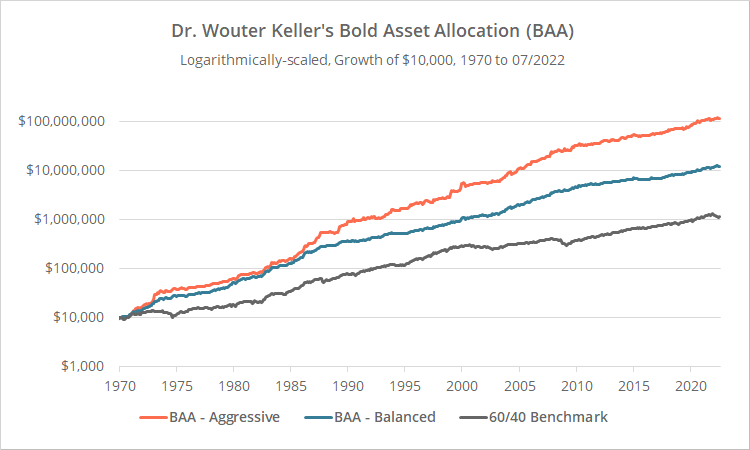
This is a test of Dr. Wouter Keller’s tactical strategy “Bold Asset Allocation” (BAA) from his paper Relative and Absolute Momentum in Times of Rising/Low Yields.
Backtested results from 1970 follow. Results are net of transaction costs – see backtest assumptions. Learn about what we do and follow 60+ asset allocation strategies like this one in near real-time.

Logarithmically-scaled. Click for linearly-scaled results.
BAA comes in two flavors: Aggressive and Balanced.
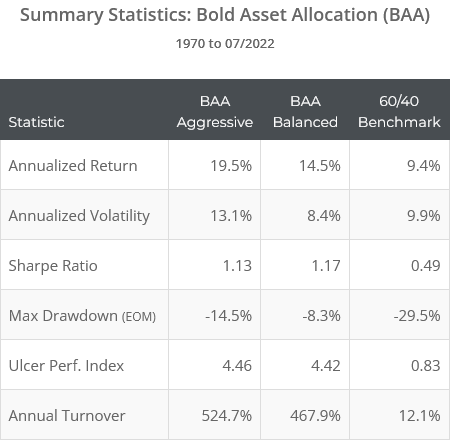
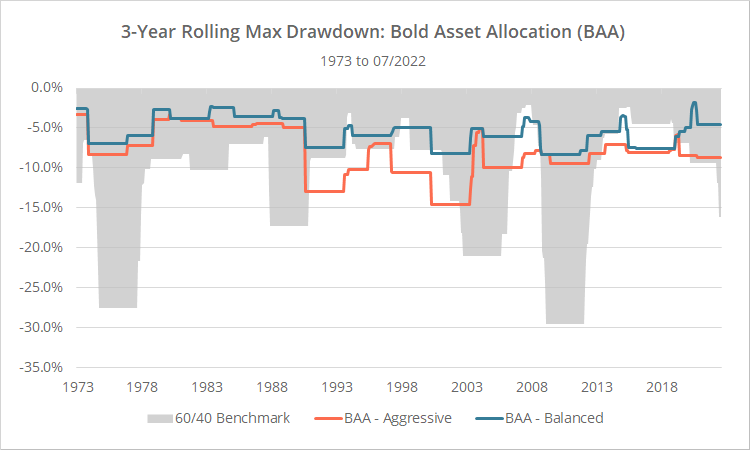
Both would have significantly outperformed the market while limiting the worst market drawdowns. As members will note, BAA ranks very high relative to other tactical asset allocation strategies that we track across a number of metrics. These are high flyers.
Strategy rules tested:
BAA builds off of concepts from previous Keller strategies:
- Protective Asset Allocation (blog, members: PAA | PAA-CPR)
- Vigilant Asset Allocation (blog, members: VAA-Aggressive | VAA-Balanced)
- Defensive Asset Allocation (members: DAA)
BAA considers three asset universes: offensive, defensive and “canary”. We’ve provided a list of assets in each universe in the end notes.
The strategy trades monthly. At the close on the last trading day of the month…
-
Start with the canary universe: S&P 500 (represented by SPY), developed intl equities (EFA), emerging market equities (EEM) and US aggregate bonds (AGG).Calculate the “13612W” momentum of each asset. This is a multi-timeframe measure of momentum, calculated as follows:(12 * (p0 / p1 – 1)) + (4 * (p0 / p3 – 1)) + (2 * (p0 / p6 – 1)) + (p0 / p12 – 1)Where p0 = the price at today’s close, p1 = the price at the close of the previous month, etc.Note how this approach overweights more recent months. Doing the math, the most recent 1-month change (p0/p1 – 1) determines 40% of the momentum score, while the most distant month (p11/p12 – 1) determines just ~2%.
-
If all canary assets have positive momentum, select from the offensive universe, otherwise select from the defensive universe.Note how cautious this criterion is. If even one canary asset is exhibiting negative momentum (which has happened about 60% of the time), we shift to the defensive universe. The inclusion of agg. bonds may seem odd, but we’ve covered bonds as a positive predictor of risk asset returns a number of times, including here and here.
-
Select from within the appropriate universe (offensive or defensive) based on a slower relative momentum measurement. Calculate relative momentum as follows:p0 / average(p0…p12)I.e. today’s price divided by the average of the most recent 13 month-end prices.
-
If selecting from the offensive universe, select the 6 assets (balanced version) or 1 asset (aggressive version) with the highest relative momentum.Warning: The aggressive version of the strategy is going all in on a single risk asset. That’s a dangerous approach. We suggest minimizing that risk by combining multiple unrelated strategies together in a combined portfolio (something our platform was built to tackle).
-
If selecting from the defensive universe, select the 3 assets with the highest relative momentum. If the relative momentum of the asset is less than that of US T-Bills (represented by ETF: BIL), instead place that portion of the portfolio in cash.Here the strategy is using both relative and absolute momentum (aka “dual momentum”). More on this in a moment.
-
Equally-weight to all assets selected at the close. Rebalance the portfolio even if there isn’t a change in signal. Hold all positions until the end of the following month.
In short: Gauge the momentum of a canary universe. If all assets exhibit positive momentum, use relative momentum to choose from an offensive universe, otherwise use dual momentum to choose from a defensive universe.
How BAA is designed for an era of low/rising yields:
The strategy’s use of “dual momentum” when selecting defensive assets is likely a better choice for the future, regardless of how it might have performed historically.
When shifting from risk on to risk off, some strategies have a bad habit of just “dumping” the portfolio into highly rate-sensitive assets like long duration government bonds, regardless of how they’re currently performing.
That worked well over most of the last 40+ years because of a multi-decade decline in interest rates. That constant tailwind made gov bonds a reliable diversifier. But as we’ve modelled a number of times, if/when this long-term decline in rates is over, gov bonds are mathematically guaranteed not to live up to the norms investors’ have grown accustomed to. Read more and more.
By requiring that defensive asset momentum exceeds T-Bill momentum, we ensure that we’re not selecting rate-sensitive assets exhibiting long-term weakness.
Other notes:
- The issue described here (blindly dumping the portfolio into rate-sensitive assets) has been a major factor in deciding which strategies have and have not been successful through 2022’s tough market. Read more.
- We attempt to model each strategy’s relationship with rate-sensitive assets in the “Exposure to Rising Interest Rates” member report.
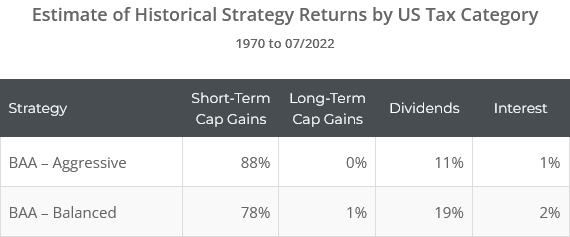
Incredibly tax in-efficient:
BAA-Aggressive is the most tax inefficient strategy we track, and BAA-Balanced isn’t far behind (see the member report). Below are our estimates of historical strategy returns by US tax category:
Tactical Asset Allocation has generally been reasonably tax efficient, but individual strategies vary widely (read more). BAA has been particularly bad at tax management. That may or may not matter depending on the type of account being traded, but we thought it worth mentioning.
Our take on Bold Asset Allocation (BAA):
BAA ranks very high relative to other strategies we track across a number of metrics.
That means that BAA is inevitably going to get a lot of visibility, making it more likely to be chosen by members. That also means that we’re going to be a lot harsher in our criticism of the strategy. We are big fans of Keller’s work, so we hope that this criticism is seen as constructive.
* * *
BAA is a mashup of concepts from previous Keller strategies (PAA, VAA and DAA). Each of those strategies employs some unique feature that has made that strategy successful in backtests. More importantly, Keller’s strategies remain among the top performers we track in real-time out-of-sample trading. That’s a feather in the cap.
Here’s the rub: the more we “stack” historically successful observations on top of each other the way that BAA does, the more we increase the likelihood of overfitting to the historical data. There are techniques to try to reduce that risk, but from reading Keller’s paper, it feels like he’s mostly brute forced a single optimal combined solution.
That problem is exacerbated when we’re not only combining features, but also finding the custom asset universe that has performed best on those combined features. This was a more glaring issue in version 1 of the paper, but it remains an issue nonetheless in version 2 (which we track).
In our humble opinion, there is probably a larger than usual helping of overfitting built into BAA. What does that really mean though?
First off, all backtests are overfit to some degree. It’s an inherent side effect of using historical data to make predictions about the future. The market rhymes, it does not repeat.
At one extreme, you can create backtests that are so perfectly fit to the historical data that they are completely useless out-of-sample. We’ve all seen these types of silly strategies that less savvy investors often fall prey to: buy specific mutual fund X when RSI(2) is below 20 and the DJIA is in an uptrend on the triple witching day in odd numbered months.
These hyper-specific strategies may produce stellar backtested results, but they’re probably no better than a coin flip out of sample. Side note: this is often the case with poorly designed machine learning strategies as well.
BAA is not that. BAA is stacking tried-and-true individual observations that have each been successful for many decades on their own, but using a degree of brute force to determine the optimal way to combine those individual observations.
We would expect the final product to still “work”, but we would also expect the backtested results to paint an overly optimistic picture of what an investor should expect moving forward. In other words: investors’ expectations about the future should be tempered.
Again, this is true for all strategies to one degree or another. We make special mention of it here because BAA tests so well historically, and we worry that members will assume that those historical results are perfectly indicative of future results and take on too much risk.
The standard plan of attack still applies: Investors should diversify across multiple tactical strategies, each employing a different approach to trading the market, to reduce the risk of any one strategy going off the rails, even if (and this part is important) doing so is suboptimal historically.
A big thank you to Dr. Keller for allowing us the opportunity to put his newest strategy to the test. Despite his lack of an online presence like other more public developers, he has done so much to push TAA strategy design forward with a continuous stream of novel ideas.
New here?
We invite you to become a member for about a $1 a day, or take our platform for a test drive with a free membership. Put the industry’s best tactical asset allocation strategies to the test, combine them into your own custom portfolio, and follow them in real-time. Learn more about what we do.
* * *
Calculation notes:
In all calculations throughout this post, we’re using the dividend-adjusted closing price. And as we do throughout this site, all trades intended for BIL are instead placed in “cash” (equal to the return on 3-month US Treasuries), as that’s likely a more appropriate short-term vehicle for the foreseeable future.
Asset universes:
-
- Canary – Aggressive and Balanced: S&P 500 (represented by SPY), emerging market equities (EEM), developed Intl equities (EFA) and US aggregate bonds (AGG)
- Offensive – Aggressive: Nasdaq 100 (QQQ), emerging market equities (EEM), developed intl equities (EFA) and US aggregate bonds (AGG)
- Offensive – Balanced: S&P 500 (SPY), Nasdaq 100 (QQQ), US small caps (IWM), Europe equities (VGK), Japan equities (EWJ), emerging market equities (EEM), US real estate (VNQ), commodities (DBC), gold (GLD), long-term US Treasuries (TLT), US high-yield bonds (HYG) and US corporate bonds (LQD)
- Defensive – Aggressive and Balanced: TIPS (TIP), commodities (DBC), US Treasury bills (BIL), intermediate-term US Treasuries (IEF), long-term US Treasuries (TLT), US corporate bonds (LQD) and US aggregate bonds (AGG)


