Most Tactical Asset Allocation (TAA) strategies trade once per month. That’s by design. Short-term market movement is mostly noise, and trying to time every zig and zag is a fool’s errand.
A unique feature of our platform is the ability to follow these monthly strategies on any day of the month. We’re not just executing the same signal on a different date – we’re recalculating the signal each day, while maintaining the integrity of the original strategy.
We have long championed “tranching”: splitting the execution of monthly strategies across multiple days of the month. But members often ask about a different approach – instead of splitting execution, why not go “all in” multiple times per month? In other words, what if we traded the entire portfolio weekly, or even daily?
In this analysis, we put that idea to the test. The verdict: it’s a bad idea. Monthly TAA strategies are tuned to that monthly cadence and trading them more frequently hurts performance.
Test Setup:
We strongly believe investors shouldn’t trade a single strategy in isolation, tactical or otherwise. Combining multiple strategies into what we call “Model Portfolios” diversifies away the risk of any one strategy underperforming – so that’s what we tested here.
We created 1,000 portfolios, each with 5 randomly selected monthly strategies (out of the 90 we track), equally-weighted at 20% each. We then backtested each of these 1,000 portfolios four ways, both with and without “trading friction” (transaction costs + slippage):
- Monthly, on the last trading day of the month (as designed)
- Semimonthly
- Weekly
- Daily
Geek note: See the “calculation note” at the end of this analysis for more details.
Test Results: With and Without Trading Friction:
In the tables below we show daily/weekly/semimonthly trading results relative to the baseline (the baseline is executing strategies as designed, trading monthly on the last trading day of the month). A negative number means that approach underperformed the baseline.
We start by ignoring trading friction (transaction costs + slippage). These first results should not be viewed as conclusive because they ignore a key component of return, but they do help to paint a picture of gross vs net results.
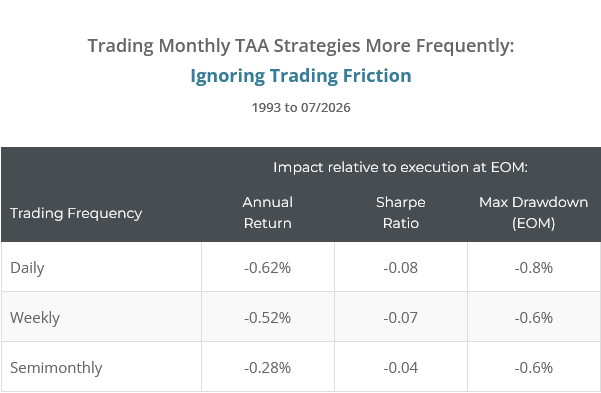
Even before accounting for friction, trading more often hurts performance. Max drawdown is the metric you’d most expect to see benefit from more frequent trading due to more quickly responding to changing markets, but even here, results were negative.
Next, we add trading friction (0.1% per trade, 0.2% round-trip):
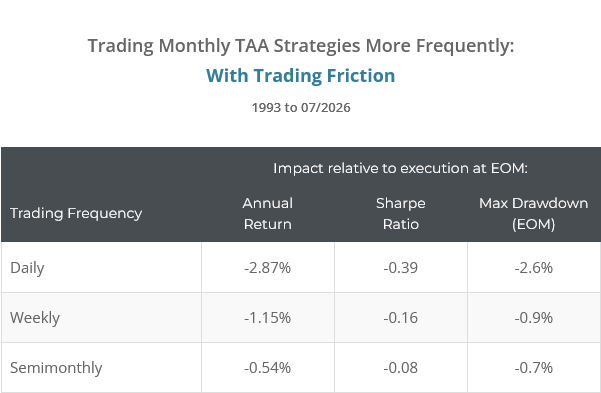
These results paint a more pessimistic (but also realistic) picture. As expected, the drag from trading friction increases with trading frequency, exceeding 2% p.a. when trading daily. This additional unproductive trading friction is the nail in the coffin of trading monthly strategies more often.
Trading friction is unavoidable. Even zero-commission ETFs carry slippage. We assume a reasonably conservative 0.1% per trade (0.2% round-trip). You may be able to drive that lower, especially trading large, liquid ETFs, but it will never be zero.
Digging deeper (for we TAA geeks): EOM execution vs non-EOM execution
Savvy readers will recall we’ve shown that trading at month-end has historically outperformed trading on other days. See our previous discussions on this, along with the latest statistics.
Setting trading friction aside, much of the underperformance when trading daily, weekly, or semimonthly comes simply from exposure to those underperforming trading days. This holds true for tranching as well.
So our headline finding – “trading monthly strategies more frequently underperforms” – can be expressed with more nuance:
- Some of the underperformance when trading more frequently is simply the historical gap between EOM and non-EOM execution.
- Accepting this gap when “tranching” (i.e. when spreading execution across multiple days of the month) may be worth it, because:
- We don’t know whether EOM’s historical edge persists going forward, and tranching diversifies away that risk, and –
- It adds little in extra transaction costs (assuming no flat per-trade commissions on a small account).
- However, that same trade-off is not worth it when you trade the entire portfolio more often (i.e. the approach we’ve tested here) because:
- Unlike tranching, it significantly increases trading friction, but –
- Gross performance doesn’t improve to compensate.
Conclusion:
The takeaway is straightforward:
Most TAA strategies are built around a monthly cadence, and that design choice matters. Trading them more frequently doesn’t add precision – it adds churn and cost, without a commensurate increase in performance.
That doesn’t mean investors have no flexibility in how they execute monthly strategies. Tranching – spreading execution across multiple days – remains a reasonable way to smooth out single-day execution risk without abandoning the monthly cadence the strategy was designed around. But trading the entire portfolio more often is an entirely different thing, and the data makes clear: it raises costs without improving performance.
If a strategy was built to trade monthly it should be traded monthly, and investors who wish to trade more frequently, should use tranching.
Other Reading:
Other things we’ve written about deviating from a strategy’s original design:
- Delaying execution by a full day (i.e. signal today, execute tomorrow) has had little impact on long-term performance, and can make execution less stressful. Read more.
- “Rolling up” small positions into more generic assets has also had little impact on long-term performance, and makes position management easier. Read more.
- Read more about trading on days other than month-end, tranching and “timing luck.”
New here?
We invite you to become a member for about a $1 a day, or take our platform for a test drive with a free membership. Put the industry’s best tactical asset allocation strategies to the test, combine them into your own custom portfolio, and follow them in real-time. Learn more about what we do.

* * *
Calculation note: We took some shortcuts to make this analysis more manageable. None affect the basic conclusions of this analysis.
- Daily execution: Trades only occurred on days with an associated “normalized trading day” (which is the vast majority of days, but not all). Learn more.
- Weekly execution: Our platform is not oriented around calendar weeks, but we approximated weeks with a roughly 5 trading-day spacing. We assumed trades were executed on normalized trading days 5, 10, 15 and 21.
- Semimonthly execution: We assumed trades were executed on normalized trading days 10 and 21.