We track 100+ Tactical Asset Allocation (TAA) strategies. A unique feature of our platform is our Aggregate Allocation Report, a daily snapshot of the average asset allocation across all of the strategies we track.
To illustrate, in the graph below we show the aggregate allocation over the last 3 years, summarized by asset category. Note the increase in defensive allocation (ex. cash and bonds) during market weakness, the collapse in exposure to gold, and the pivot from US to international risk assets.
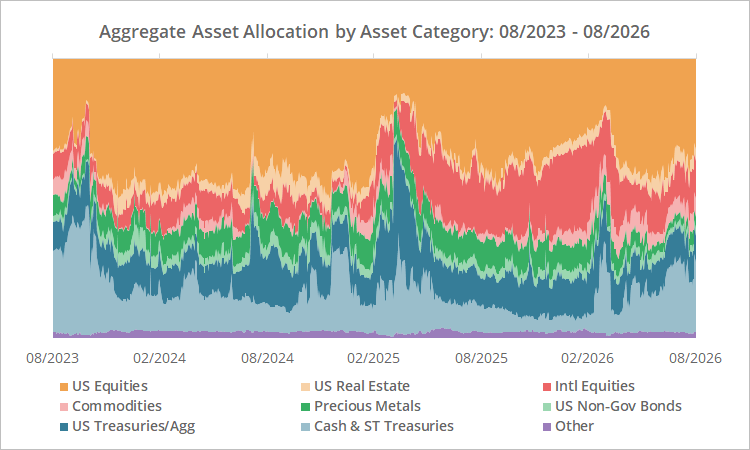
The Aggregate Allocation Report is not intended to be a trading signal – it’s meant to be a barometer, providing insight into what TAA as a trading style is saying about the market. But members often ask about just that; could the report be traded? The idea isn’t without merit; in a sense, it represents the ultimate diversified TAA portfolio.
In this analysis we explore that question. The short answer is, yes, the aggregate allocation has value as a trading signal if utilized correctly. It’s a blunt instrument though, and a diversified, handcrafted Model Portfolio, tailored to your specific goals, will likely outperform blindly trading the aggregate.
Test #1: Ignoring Trading Friction, Same Day Execution
We start with the simplest test.
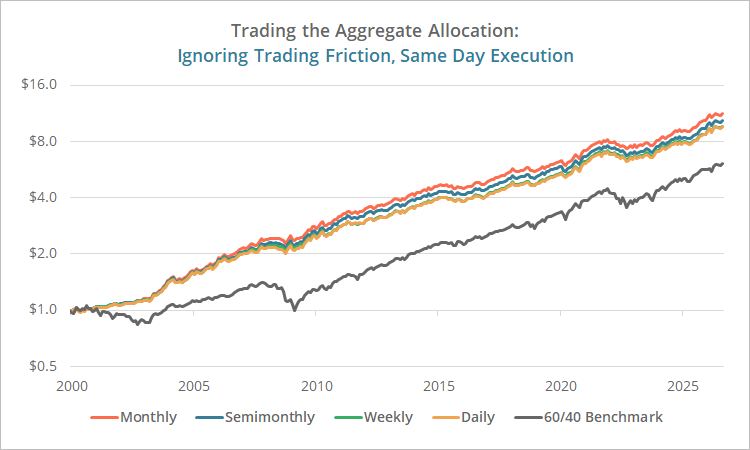
We assume that every day, week, half-month or month-end, the investor matched today’s aggregate allocation (by individual ticker) in their own portfolio at today’s close.
This first test makes two generous assumptions: it ignores trading friction (transaction costs + slippage), and it assumes today’s aggregate allocation is available at the close. Think of these results as a best-case ceiling.
| Summary Statistics Ignoring Trading Friction, Same Day Execution 2000 to 08/2026 |
|||
|---|---|---|---|
| Cadence | Annual Return |
Sharpe Ratio |
Max Drawdown (EOM) |
| Monthly (EOM) | 9.5% | 1.12 | -10.5% |
| Semi-monthly (Mid-Month + EOM) | 9.2% | 1.06 | -11.3% |
| Weekly | 8.9% | 1.02 | -11.0% |
| Daily | 8.8% | 1.02 | -10.6% |
| Benchmarks | |||
| 60/40 Benchmark | 7.0% | 0.56 | -29.5% |
| S&P 500 (SPY) | 8.3% | 0.42 | -50.8% |
The result: every cadence from daily to monthly significantly outperformed the benchmark, especially in terms of risk-adjusted performance and managing losses. Slower cadences edged out faster cadences, but the difference was slight.
Test #2: With Trading Friction, Same Day Execution
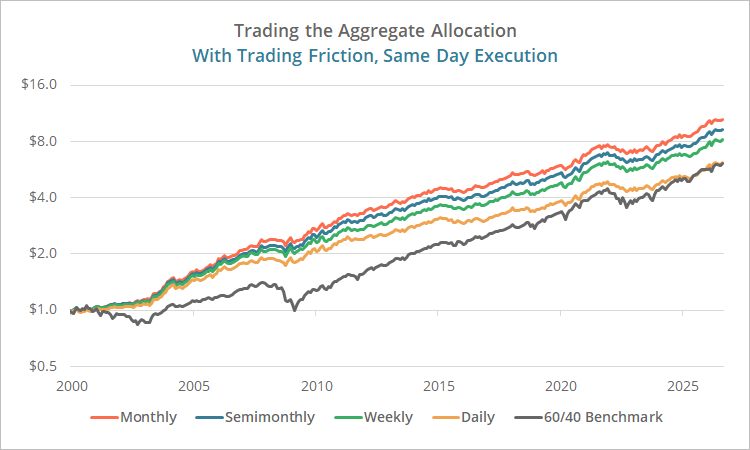
Trading friction (transaction costs + slippage) is unavoidable. Even zero-commission ETFs carry slippage. We assume a reasonably conservative 0.1% per trade (0.2% round-trip). You may do better, especially trading large, liquid ETFs, but friction will never be zero.
In this test, we add trading friction to our test.
| Summary Statistics With Trading Friction, Same Day Execution 2000 to 08/2026 |
|||
|---|---|---|---|
| Cadence | Annual Return |
Sharpe Ratio |
Max Drawdown (EOM) |
| Monthly (EOM) | 9.2% (-0.3%) |
1.08 (-0.04) |
-10.6% (-0.1%) |
| Semi-monthly (Mid-Month + EOM) | 8.7% (-0.4%) |
1.00 (-0.07) |
-11.5% (-0.2%) |
| Weekly | 8.2% (-0.7%) |
0.92 (-0.10) |
-11.3% (-0.3%) |
| Daily | 7.0% (-1.8%) |
0.75 (-0.27) |
-11.4% (-0.8%) |
| Benchmarks | |||
| 60/40 Benchmark | 7.0% | 0.56 | -29.5% |
| S&P 500 (SPY) | 8.3% | 0.42 | -50.8% |
| Number in parenthesis shows impact of trading friction. | |||
As expected, the drag from trading friction increases with trading frequency, nearing 2% p.a. when trading daily. That tracks with what we know: most TAA strategies are designed to trade monthly and trading them more frequently slightly hurts performance gross, but significantly hurts performance net (read more).
If an investor were to use the Aggregate Allocation Report as a trading signal, it would be most effective to do so with a monthly or semi-monthly cadence.
Alternatively, the investor could “tranche” the portfolio across the month so that only a portion of the portfolio trades each day, maintaining the monthly cadence for each slice.
Test #3: With Trading Friction, Next Day Execution
All the results shown so far are not technically possible on our platform. The Aggregate Allocation Report is generated nightly, and the tests above assumed that an investor had perfect foresight of that night’s results.
So, in the results below we’ve added a 1-day lag to execution. In other words, the investor reviewed the report last night but didn’t execute trades until today’s close.
| Summary Statistics With Trading Friction, Next Day Execution 2000 to 08/2026 |
|||
|---|---|---|---|
| Cadence | Annual Return |
Sharpe Ratio |
Max Drawdown (EOM) |
| Monthly (EOM) | 9.2% (-0.1%) |
1.06 (-0.02) |
-10.6% (0.0%) |
| Semi-monthly (Mid-Month + EOM) | 8.8% (+0.1%) |
1.00 (0.00) |
-12.9% (-1.4%) |
| Weekly | 8.3% (+0.1%) |
0.94 (+0.02) |
-11.3% (-0.1%) |
| Daily | 7.2% (+0.2%) |
0.78 (+0.03) |
-11.8% (-0.4%) |
| Benchmarks | |||
| 60/40 Benchmark | 7.0% | 0.56 | -29.5% |
| S&P 500 (SPY) | 8.3% | 0.42 | -50.8% |
| Number in parenthesis shows impact of next day execution. | |||
We didn’t bother including an equity curve here, because the results are so similar. Across all cadences, there was little impact from delaying execution. This isn’t surprising. As we’ve shown previously, adding a 1-day lag to the execution of a diversified TAA portfolio has had little impact on long-term performance (read more).
Test #4: Individual Tickers, Categories and Risk On/Off
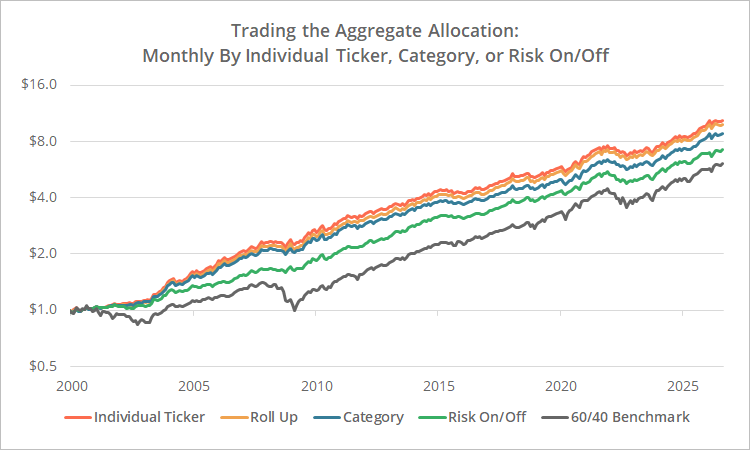
The Aggregate Allocation Report includes multiple levels of granularity:
- Individual asset tickers (which we’ve tested up to this point)
- Asset categories: e.g., “US Equities” includes everything from the S&P 500 to individual stock market sectors.
- Risk on/off: “Risk On” includes equities, real estate and high-yield bonds. “Risk Off” includes everything else.
- Roll up: This is not part of the Aggregate Allocation Report, but we’ve added it to our test to show a more practical approach to trading individual tickers. We assume that we “rolled up” allocations < 2% into more generic asset classes. See this analysis to learn more.
Below we show the results of trading each level of granularity. Each asset category and risk on/off is each represented by a single ticker (see the calculation notes at the end of this analysis for a list). Results include trading friction and a 1-day lag in execution.
| Summary Statistics Monthly by Individual Ticker, Category, or Risk On/Off 2000 to 08/2026 |
|||
|---|---|---|---|
| Granularity | Annual Return |
Sharpe Ratio |
Max Drawdown (EOM) |
| Individual Tickers | 9.2% | 1.06 | -10.6% |
| Asset Category | 8.5% (-0.7%) |
1.01 (-0.05) |
-11.3% (-0.7%) |
| Risk On/Off | 7.7% (-1.5%) |
0.93 (-0.13) |
-13.1% (-2.5%) |
| Roll Up Allocations < 2% | 9.0% (-0.2%) |
1.04 (-0.02) |
-11.2% (-0.6%) |
| Benchmarks | |||
| 60/40 Benchmark | 7.0% | 0.56 | -29.5% |
| S&P 500 (SPY) | 8.3% | 0.42 | -50.8% |
| Number in parenthesis shows impact of granularity vs trading individual tickers. | |||
Broadly speaking, less granular approaches have underperformed, but much of the difference came prior to 2010, and results have been fairly similar since.
The takeaway is that granularity matters, but only to a point. Investors could capture substantially all of the Aggregate Allocation Report’s performance using either asset categories or a simple 2% roll up.
Data dump:
This data can be sliced and diced many ways. Click for a CSV file showing all combinations of trading frequency, granularity, same/next-day execution, and trading friction.
Conclusion:
Yes, the Aggregate Allocation Report has value as a trading signal, assuming a slow enough cadence (monthly or semi-monthly, or tranching). Assets could be combined either by asset category or using a simple 2% asset rollup.
Understand however that this is a very blunt instrument. A diversified, handcrafted Model Portfolio, tailored to your specific goals, will likely outperform blindly trading the aggregate.
New here?
We invite you to become a member for about a $1 a day, or take our platform for a test drive with a free membership. Put the industry’s best tactical asset allocation strategies to the test, combine them into your own custom portfolio, and follow them in real-time. Learn more about what we do.

* * *
Calculation notes:
We also covered this subject back in 2020. Read our previous analysis.
Risk On/Off: All equity, real estate and HY bond assets are categorized as risk on, and all other assets as risk off. Cash is treated separately. Risk on is represented by a single proxy asset SPY and risk off by IEF.
Asset Categories: All assets are grouped into categories, and each category is represented by a single proxy asset as follows: US equities (SPY), US real estate (VNQ), US gov bonds (IEF), US non-gov bonds (LQD), intl equities (IEFA), intl real estate (VNQI), intl bonds (BWX), precious metals (GLD), commodities (PDBC) and cash. Currency and market neutral categories are too small to impact results and are held in cash.
Daily execution: Trades only occurred on days with an associated “normalized trading day” (which is the vast majority of days, but not all). Learn more.
Weekly execution: Our platform is not oriented around calendar weeks, but we approximated weeks with a roughly 5 trading day spacing. We assumed trades were executed on normalized trading days 5, 10, 15 and 21.
Semi-monthly execution: We assumed trades were executed on normalized trading days 10 and 21.