This is an independent test of a novel strategy from David Varadi: Inflation Compass. It builds on his earlier Growth and Inflation strategy by adding a direct market-based measure of expected inflation. We’re testing two versions of his new strategy: Original and Enhanced (more on this later).
Backtested results from 1990 follow. Results are net of transaction costs – see backtest assumptions. Learn about what we do and follow 100+ asset allocation strategies like this one in near real-time.
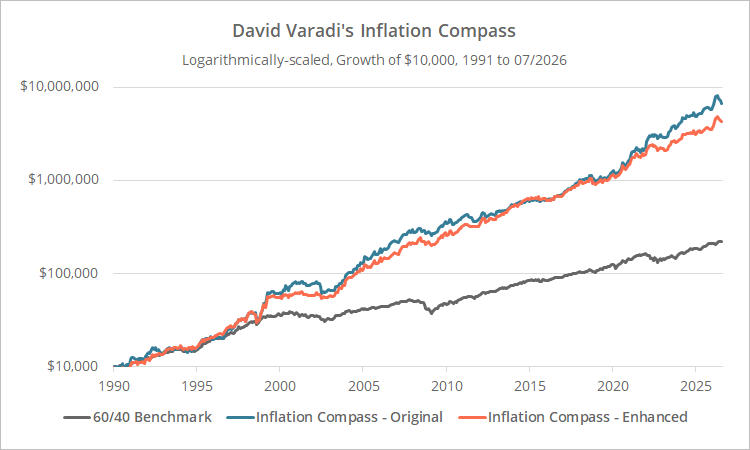
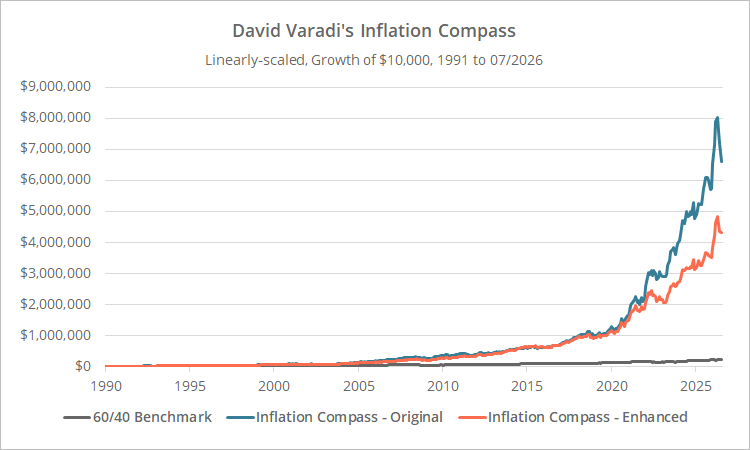
Logarithmically-scaled. Click for linearly-scaled results.
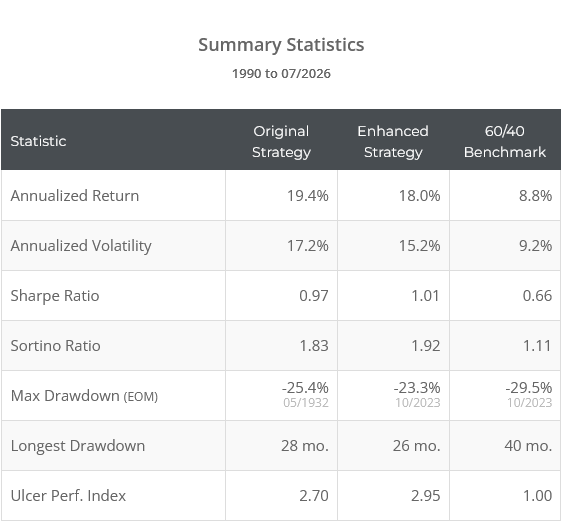
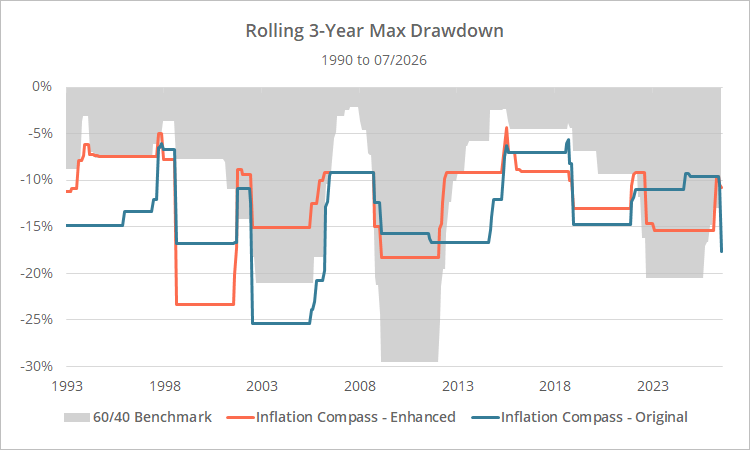
Note: Below we’ve shown the rolling 3-year max drawdown, rather than the spot drawdown we usually show (otherwise the chart becomes a pile of spaghetti).
A word of warning: this is an extremely volatile strategy, usually allocating the entire portfolio to a single stock market sector. Investors should think of it as a unique risk asset – not a total portfolio solution – and limit it to a reasonably sized allocation within a broader, diversified Model Portfolio.
How this strategy works:
We covered much of the underlying theory behind this strategy in our previous test of Growth and Inflation. Here’s a quick refresher:
Most investors are familiar with the classic “four seasons” framework, which categorizes the current market environment based on economic growth versus inflation. Variations of this concept underpin well-known strategies such as the Permanent Portfolio and All-Weather Portfolio.
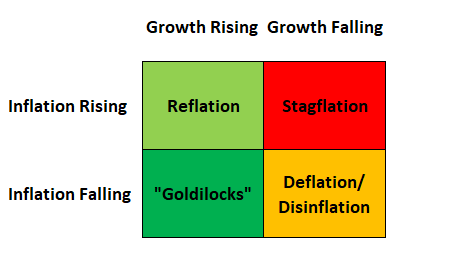
Different sectors tend to perform best in each quadrant. The challenge, of course, is identifying the current market environment in real time.
Varadi uses the current trend of the S&P 500 to measure forward growth. The S&P 500 is inherently forward-looking and has been a good proxy for future US economic growth over the last 120 years.
His original Growth and Inflation strategy forecasted inflation using an indicator called “Sector-Implied Expected Inflation”. It measures the relative performance of sectors with positive beta to expected inflation (energy, financials, industrials and materials) versus sectors with negative beta (consumer staples, health care and utilities).
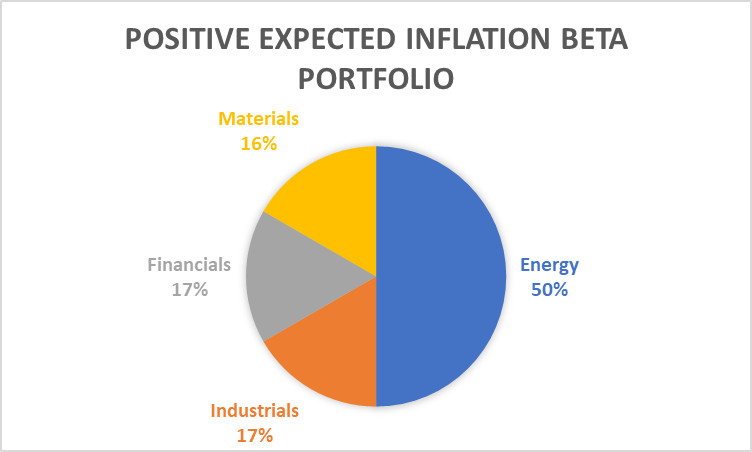
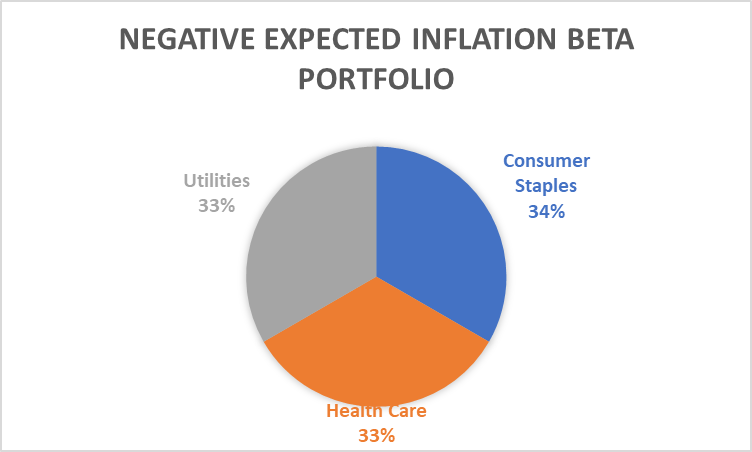
Varadi’s new strategy takes this idea a step further by also directly forecasting inflation via the 5-year Breakeven Inflation Rate (T5YIE), calculated as the spread between nominal Treasury yields and TIPS yields. This spread represents investors’ expectations for future inflation (plus some other things, more on this later).
Inflation is considered to be rising when:
- The breakeven inflation rate is above 2%, and –
- Either the breakeven inflation rate or sector-implied expected inflation is rising.
Now that we’ve determined both the growth and inflation regime, the strategy selects the best ETF for that environment:
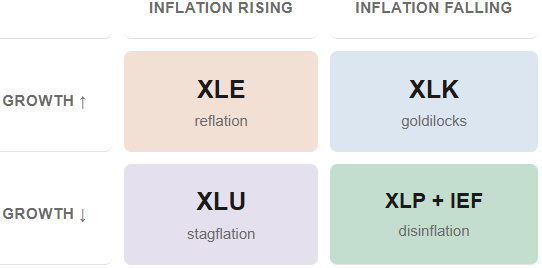
XLE = energy, XLK = technology, XLU = utilities, XLP = cons. staples, IEF = US Treasuries
The strategy trades monthly. Positions are assumed to be executed at the close on the final trading day of each month and held for the following month.
Original vs Enhanced:
We’re tracking two versions of Inflation Compass.
“Original” is a replication of Varadi’s published strategy. We’ve extended his test with a decade-plus of additional data. Data prior to 2003 can be considered out-of-sample.
“Enhanced” incorporates several refinements proposed by the author. The most significant is parameter diversification (aka “ensembling”). Rather than relying on a single lookback period – for example, the 60-day change in the breakeven rate – the Enhanced version averages the signal across multiple parameter values. This diversification helps to smooth future returns by reducing the “specification risk” of any single parameter value underperforming.
We rarely state one strategy is better than another. We present the evidence and let members draw their own conclusions. That said, we prefer the Enhanced version. The Original version could certainly outperform going forward, but by reducing specification risk, the Enhanced version narrows the range of possible future outcomes.
Potential risks to future performance:
This strategy would have produced exceptional returns. When we cover high performing strategies like this, we want to be extra skeptical in our coverage. The strategy “sells itself”; it doesn’t need our help. Our focus should be on potential risks to future performance.
Below we discuss what we view as the two most significant:
Risk #1: Major asset classes are hard to predict; sectors are even harder
First, an obvious risk. It’s one thing to say that during a given economic condition a broad asset class like stocks or bonds will perform well. That’s difficult enough on its own. It’s even harder to identify the specific sector that will outperform.
The best example is the “reflation” asset, energy (XLE), which is also the strategy’s most frequently held asset. As global energy production and consumption changes in the coming decades, will XLE continue to be the most productive reflation asset? There’s a risk of that not being the case.
Perhaps a future version of the strategy could either (a) take a more adaptive approach to selecting sectors or (b) hold multiple diversifying sectors.
Risk #2: TIPS breakeven inflation forecasts vs alternative inflation forecasts
This second potential risk is more nuanced. As Varadi explains, TIPS are a quirky inflation predictor:
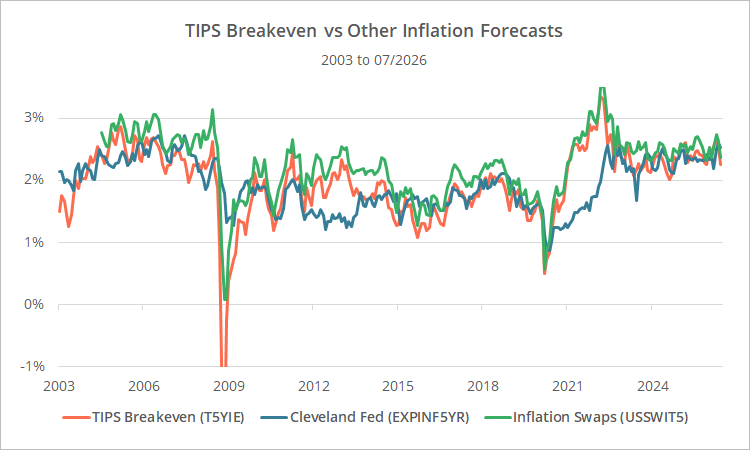
Let’s consider alternative measures of 5-year future inflation. Below is a comparison of the TIPS breakeven rate, inflation swaps (Bloomberg: USSWIT5) and the Cleveland Fed’s forecast (EXPINF5YR).
Each measure has its own strengths and weaknesses:
- Inflation swaps are market-based like the breakeven rate and avoid TIPS’ liquidity-related distortions, but they introduce their own unique quirkiness, such as counterparty risk.
- The Fed forecast is published monthly and is partly survey-driven. It tends to react more slowly than market-based measures and is more anchored to recent inflation levels.
- The Fed forecast will often match the TIPS breakeven rate more closely during calm markets, but inflation swaps match more closely during market stress.
If we re-backtest the strategy, replacing the TIPS breakeven rate with one of these other inflation forecasts, performance declines. Importantly however, it declines much less when using inflation swaps than when using the Fed forecast.
Below are the results for the Original strategy as designed, versus results based on the alternative inflation forecasts.
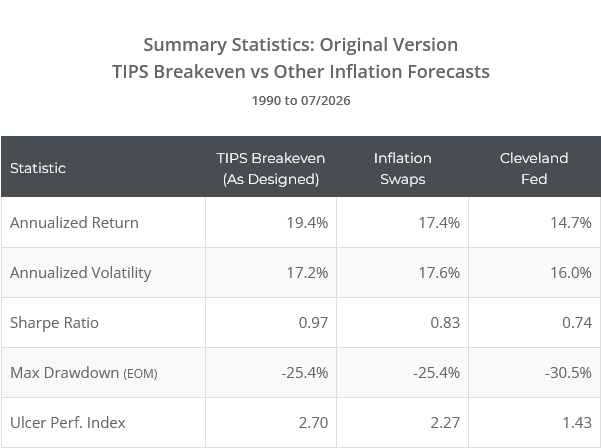
That suggests two explanations:
- The first is encouraging: TIPS contain unique, actionable information that isn’t reflected in the other forecasts, and the strategy is exploiting that.
- The second is less encouraging: the strategy is overfit to periods when TIPS diverged from other measures due to a lack of liquidity or other reasons not related to actually forecasting inflation, particularly in 2008/2009 and 2020/2021.
Our conclusion falls between the two.
There is clearly actionable information in the market-driven TIPS and inflation swap forecasts not accounted for in the Fed forecast, especially during periods of market stress when moving quickly matters.
But there’s probably not enough difference between the TIPS and inflation swap forecasts to say with 100% certainty one set of results is “more right” than the other in terms of what they say about the future. Investors should err on the side of caution and view the inflation swap results (which are still quite good) as a better reflection of strategy performance.
Having said all of that, there is a risk that the distortions introduced by both market-based inflation forecasts don’t play out in the future the way they have in the past and the strategy doesn’t perform as well during future periods of market stress. The fact that we have so little data to consider (by TAA standards), exacerbates that risk.
David Varadi is a pioneer in the online quant space
Our thanks to David Varadi for sharing this strategy and giving us the opportunity to put it to the independent test.
Readers familiar with David’s work know he has been producing thoughtful, unconventional ideas like Inflation Compass for a very long time. He’s one of the pioneers in the online quant space. We highly recommend following what David is doing at CSS Analytics.
New here?
We invite you to become a member for about a $1 a day, or take our platform for a test drive with a free membership. Put the industry’s best tactical asset allocation strategies to the test, combine them into your own custom portfolio, and follow them in real-time. Learn more about what we do.