Most government bond funds have suffered major losses this year.
What is worse is that those major losses have come when they’re needed most, when stocks and other risk assets are also falling. During times of market stress, gov bonds tend to act as a counterbalance to risk assets, but so far this year they’ve failed to deliver when needed.
Data dump:
It has been 71 trading days since the S&P 500 (represented by SPY) experienced its last all-time closing high on 01/03/2022. Since that time, SPY is down -8.2%. Over that same period, intermediate-term US Treasuries (IEF) are down -8.9%.
Geek note: We’re using IEF as our proxy for government bonds, but the same basic conclusions would hold for longer (ex. TLT) or shorter (ex. IEI) durations, and for most international gov bonds (ex. BWX). There have been some less terrible performers such as TIPS.
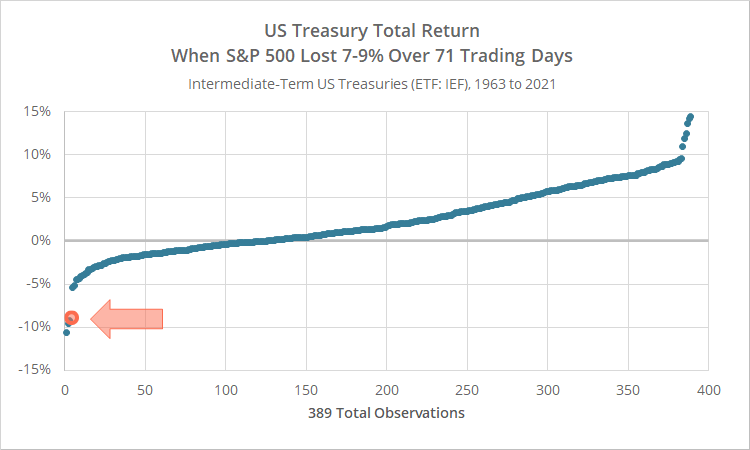
How out of character is it for SPY and IEF to both be down by such a large amount? In the graph below we look at 389 instances between 1963 and 2021 when the S&P 500 lost between -7% and -9% over 71 trading days (roughly inline with what we’ve experienced so far this year). We then plot the return for US Treasuries over that same period, sorted from worst to best.
The orange datapoint represents our current 71-day period.
US Treasuries were up in 68% of instances, with an average return of 2.3%. In only 3 cases did Treasuries perform worse than they are currently (those 3 previous instances occurred in 1980, 1987 and 1994).
The comparison is a little misleading though, because for most of this 60-year period Treasury yields were significantly higher than they are today. That higher yield acted as a cushion against any short-term impact of rising interest rates (read more).
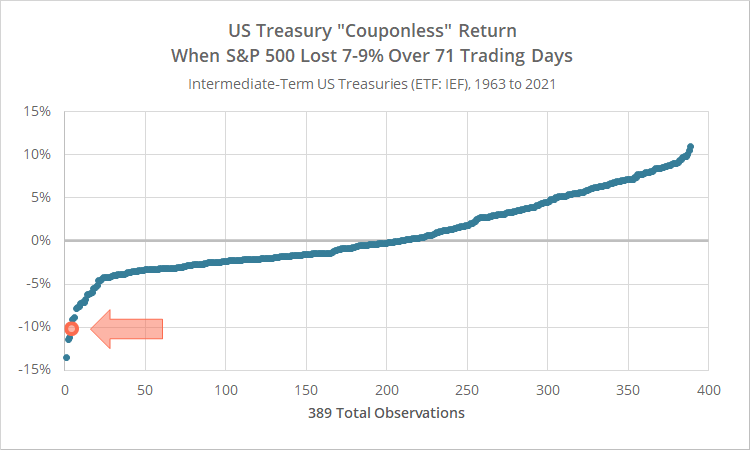
In the graph below we’ve accounted for that by showing the performance of a hypothetical “couponless” US Treasury. By ignoring the coupon, we’re only measuring the impact of changes in interest rates over the 71-day period. That makes for more of an apples-to-apples comparison with the current environment.
Our couponless Treasury investment was up in 46.3% of instances, with an average return of 0.7%. That’s a lot worse than we saw in our first test, meaning that a significant portion of the ability of Treasuries to counterbalance losses in risk assets is a result of the coupon (making them less effective at doing so in today’s era of low rates).
Having said that, our current 71-day period (orange datapoint) is still way outside of historical norms. As in our previous test, in only 3 cases did our couponless Treasury investment perform worse than it is currently.
Putting losses in government bonds in perspective:
To reiterate, we’re using IEF as our proxy for government bonds, but the same basic conclusions would hold for longer (ex. TLT) or shorter (ex. IEI) durations, and for most international gov bonds (ex. BWX).
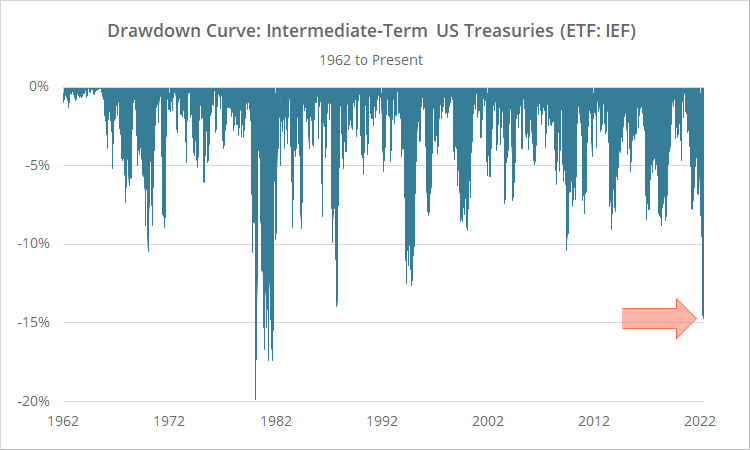
In the graph below we’ve shown historical drawdowns for intermediate-term US Treasuries since 1962. The current drawdown of -14.7% began in August of 2020, but nearly two-thirds of that loss came this year alone.
The current drawdown in gov bonds is in the vicinity of other peak drawdowns over the last 60 years.
We’ve written a lot about how government bonds might perform in an era of rising rates:
- Modelling Treasury ETF Performance in an Era of Rising Rates
- How to Play US Treasury ETFs in an Era of Rising Rates
- The Threat of Rising Rates and the Impact on TAA vs B&H Investing
-
From our sister site BetterBuyAndHold.com:
Buy & Hold Backtests are (Inherently) Wrong: Currentizing 16 Popular B&H Strategies
Importantly, an extended period of rising interest rates could have a more severe impact in today’s market than in the 1960’s and 70’s. Yields rose from a higher base then, and that helped to cushion the impact of rising rates.
Impact on Tactical Asset Allocation (TAA) strategies:
Broadly speaking, TAA has done what it’s always done through this year’s market weakness. Initial market losses have been pared down, and portfolios are now positioned more defensively.
Having said that, individual strategy performance has varied widely. One negative characteristic of some strategies that this crisis has painfully exposed is treating longer duration gov bonds (like IEF or TLT) as a catchall defensive asset, with no ability to rotate out of them when they underperform.
For example, consider the performance of a pair of popular strategies we track: Protective Asset Allocation versus Protective Asset Allocation “CPR” (learn more). Both versions of PAA are identical, except CPR has the ability to rotate out of US Treasuries when they are underperforming. PAA is down -11.1% YTD after moving out of stocks (good move) and into US Treasuries (bad move) early in the year. PAA-CPR did the same, but moved into cash, and is down just -3.0%.
We attempt to model this potential interest rate exposure, using both quantitative and qualitative measures, for all 66 strategies we track, in our Exposure to Rising Interest Rates report.
- Of the 18 strategies with more risk from rising interest rates than the 60/40 benchmark, not one is up this year (average return = -8.6%).
- Of the 25 strategies with less than half the risk from rising interest rates than the 60/40 benchmark, more than half are up this year (average return = -1.0%).
This issue of interest rate exposure has clearly come home to roost in 2022.
Meta Strategy:
Meta is a combination of 10 strategies, chosen as a representative sample of the best strategies on our site. So far this year, Meta has underperformed the average strategy that we track. One reason for that is too much exposure to strategies with high interest rate risk.
We attempted to adjust for interest rate risk when we initially designed Meta. When selecting the 10 strategies, we discount each strategy’s historical performance based on where rates stand today. Strategies that have relied on rate-sensitive assets to generate returns are less likely to be chosen. It appears however, we didn’t go far enough by not incorporating the more intensive quantitative and qualitative measures we include on members’ Exposure to Rising Interest Rates report.
We’re going to turn up the dial on penalizing high interest rate risk strategies. This will only affect future allocations (we wear our wounds). Expect more on this subject in the coming week or so and expect some of the 10 strategies selected for end-of-month April to possibly change before 04/29.
In summary:
- Government bonds have suffered major losses this year. The current drawdown in gov bonds is in the vicinity of other peak drawdowns over the last 60 years.
- What’s worse though is how poorly gov bonds have performed during a period of significant weakness in risk assets.
- Tactical strategies have the ability to move in and out of asset classes, so some selective exposure to gov bonds and other rate sensitive assets is okay, but it’s important to limit that exposure to reasonable levels (read more).
New here?
We invite you to become a member for about a $1 a day, or take our platform for a test drive with a free membership. Put the industry’s best tactical asset allocation strategies to the test, combine them into your own custom portfolio, and follow them in real-time. Learn more about what we do.


