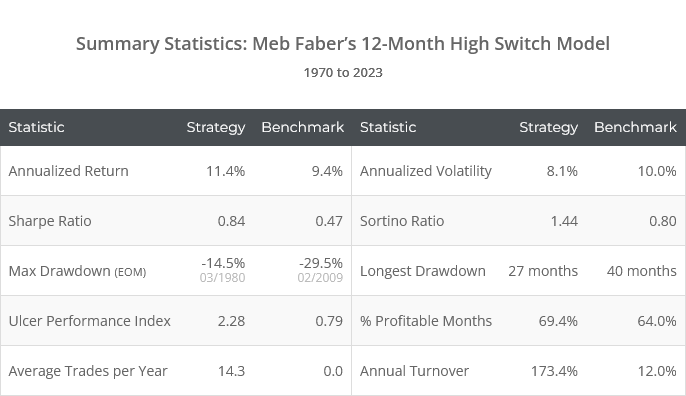
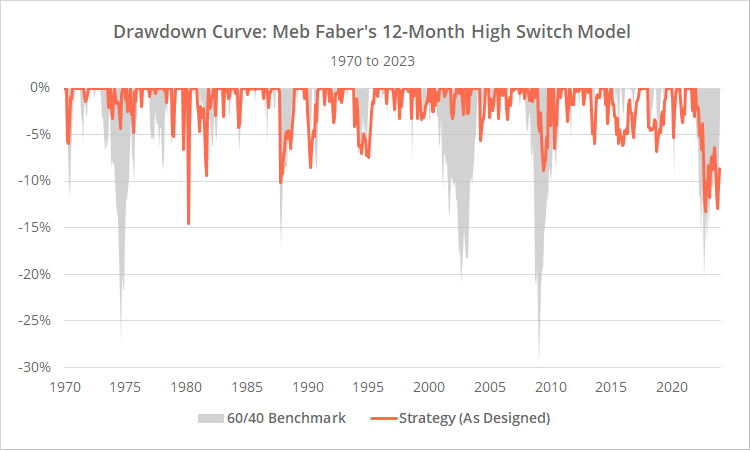
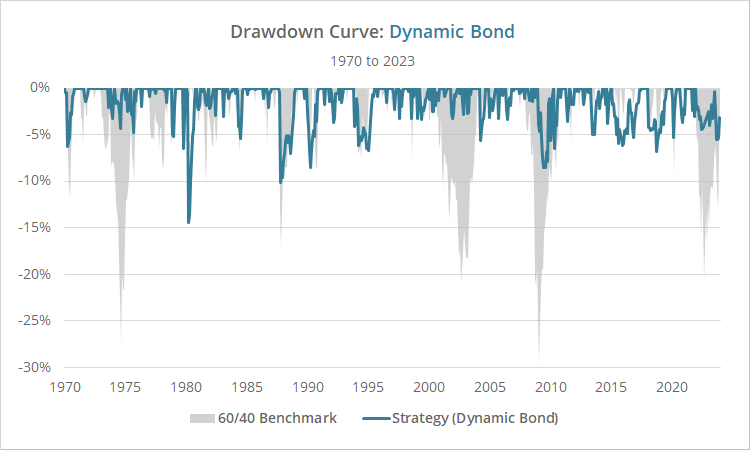
This is a test of the 12-Month High Switch Model, a Tactical Asset Allocation (TAA) strategy from Meb Faber. Meb has done more than anyone to popularize TAA as a trading style, including many of the fundamental concepts used today. This is another of his simple but effective ideas.
Backtested results from 1970 follow. Results are net of transaction costs – see backtest assumptions. Learn about what we do and follow 80+ asset allocation strategies like this one in near real-time.
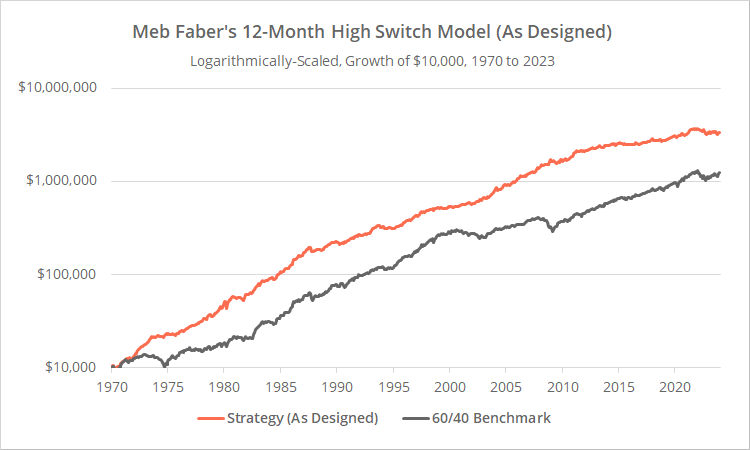
Logarithmically-scaled. Click for linearly-scaled results.
When the market is making new highs, it often scares investors away from initiating new positions out of fear that the market is overvalued or that the current trend has run its course. This strategy demonstrates that the opposite tends to be true. New highs tend to be bullish for most asset classes.
This is essentially a different flavor of trend-following. We’ve covered both all-time highs and 12-month highs previously, but we’ve never added a strategy to the platform based on these ideas.
Strategy rules tested:
-
At the close on the last trading day of the month, measure the 12-month high for five asset classes: the S&P 500 (represented by the ETF SPY), international equities (EFA), US real estate (VNQ), gold (GLD) and commodities (PDBC).The 12-month high is calculated based on dividend-adjusted month-end prices, i.e. today’s estimated close and the div-adjusted closing prices of the preceding 11 month-ends.
- Allocate 20% of the portfolio at the close to any asset that will end the month within 5% of its 12-month high.
- Any portion of the portfolio not allocated to one of the five asset classes above will instead be placed in intermediate-term US Treasuries (IEF) at the close.
- Hold all positions until the last trading day of the following month. Rebalance monthly, even if no change is signaled.
Astute readers will note that there is a potentially fatal flaw in the rules above: the strategy blindly dumps the portfolio into long duration bonds (IEF), regardless of how they are currently performing (read more). We’ll test an alternate version of the strategy later in this post that corrects for this.
Individual asset class tests:
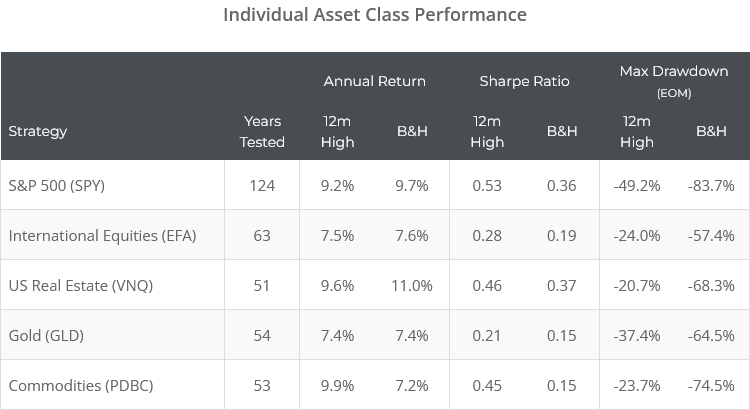
Below we’ve tested how the strategy would have performed on each of the five individual asset classes, traded in isolation. Unlike our first results, we’ve ignored transaction costs and assumed unallocated funds were placed in cash. We want to drill down on just the benefit of trading near 12-month highs.
In most cases, only trading near 12-month highs would have reduced total return – usually by a small margin. In exchange however, it would have significantly reduced drawdowns and improved risk-adjusted performance (ex. Sharpe Ratio).
We saw similar results in our previous analyses of trading at highs here and here. Like most trend-following strategies, drawdown/risk management has been a key benefit. Risk management provides a smoother ride that investors are more likely to stick with for the long-term, and has other benefits such as increasing withdrawal rates in retirement.
Geek note: Faber has used these same five asset classes in most of his TAA publications, including his seminal paper A Quantitative Approach to Tactical Asset Allocation. We’ve called out authors in the past for selecting assets that perform best with a given strategy, because that’s a recipe for overfitting. Faber has used the same recurring simple asset universe for at least 17 years. That provides a level of comfort that he’s focusing on effective core ideas, and not just trying to overfit his way to the best possible backtest.
Correcting for a fatal flaw: Dynamic Bonds
This strategy has a fatal flaw that we’ve talked about a lot over the years. It blindly dumps defensive allocation into long duration bonds, regardless of how they’re currently performing. That was fine for most of the market’s history, but that flaw was exposed in 2022 when risk assets and bonds fell simultaneously to a degree not seen in nearly 100 years (read more).
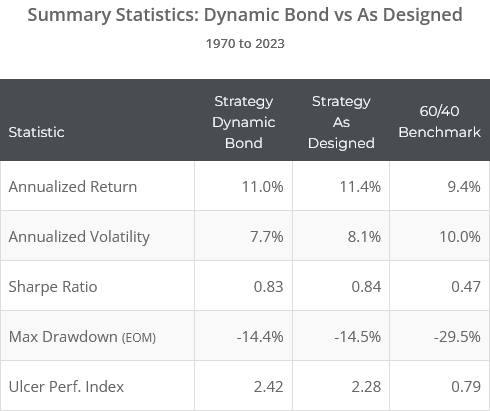
We test such strategies in two versions: (a) the strategy as it was originally designed (like the results above), and (b) a “Dynamic Bond” version (learn more). The Dynamic Bond version applies the exact same logic the strategy uses for risk assets to defensive assets as well.
For this strategy, that means we only go long US Treasuries (IEF) if they too are within 5% of a 12-month high, otherwise we shift to cash. Below are the Dynamic Bond results from 1970.
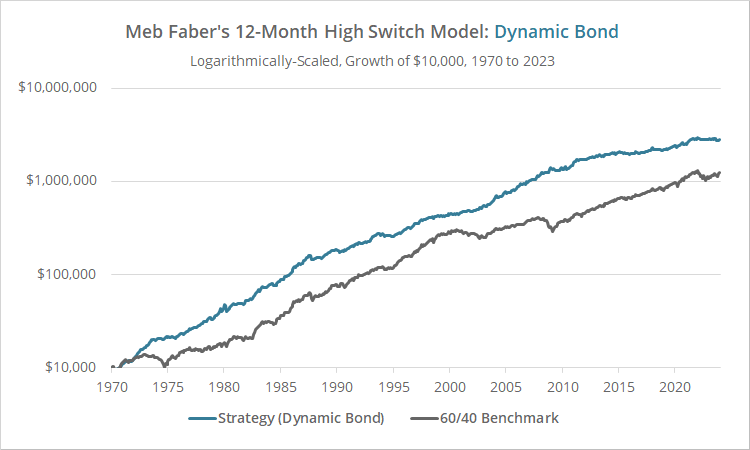
Logarithmically-scaled. Click for linearly-scaled results.
From a 30,000 foot view, these are essentially the same results. The big exception is 2022 when risk assets and bonds fell simultaneously. The Dynamic Bond version of the strategy outperformed the original strategy by a large margin (max drawdown = -5.5% vs -13.2%).
More importantly, the Dynamic Bond version is simply more resilient to future unknowns.
Our take on Meb Faber’s 12-Month High Switch Model:
This is a simple, straightforward, effective approach to TAA. Yes, it’s essentially trend-following and exhibits high correlation to other “classic” tactical strategies we track. Is it the absolute most effective approach? Maybe not, but we think that there’s value in strategic diversification, and that this strategy may be worth considering as a component of a diversified Model Portfolio.
As we showed in this analysis, there’s also value in combining this idea with conventional momentum strategies. When an asset is both exhibiting positive momentum and is near a high, it has boosted the effectiveness of the momentum signal. We think other strategy developers may want to take note and consider this in their strategy design.
A big thank you to Meb Faber for the opportunity to replicate his strategy. Again, we can’t say enough positive things about the impact Meb has had on TAA. He’s one of the good guys, and has always been very supportive of what we do. We highly recommend following what Meb is doing at MebFaber.com and at CambriaFunds.com.
New here?
We invite you to become a member for about a $1 a day, or take our platform for a test drive with a free membership. Put the industry’s best Tactical Asset Allocation strategies to the test, combine them into your own custom portfolio, and follow them in real-time. Learn more about what we do.
* * *
Member note: Up to this point, we’ve added these alternative “Dynamic Bond” variations to 10 strategies we track. In those 10 cases, we track two versions of each strategy. This is the first time since implementing this approach that we’ve added a new strategy with this issue. We’re only going to track the Dynamic Bond version in the members area, not the original. We don’t see much value in the original relative to our alternative version with our simple, but important fix.
Calculation note: Historical asset data for commodities (PDBC) does not exist prior to 12/1969, and for real estate (VNQ) prior to 12/1971. When we had insufficient data for a given asset at a given point in time, we split the portfolio evenly among the remaining assets. By 11/1972, all assets had sufficient historical data.
