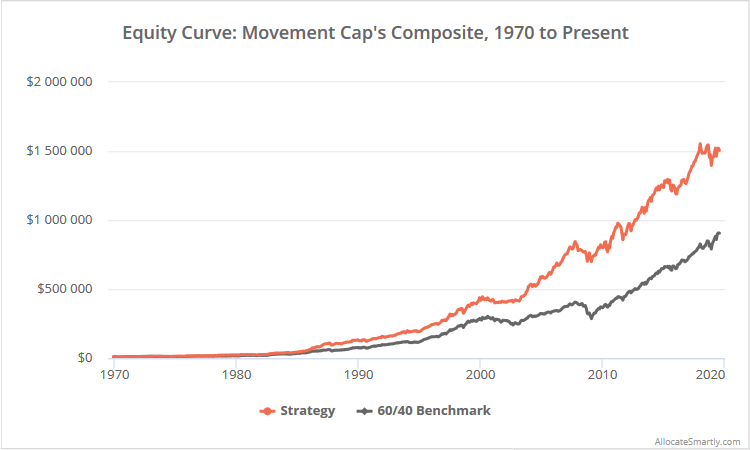
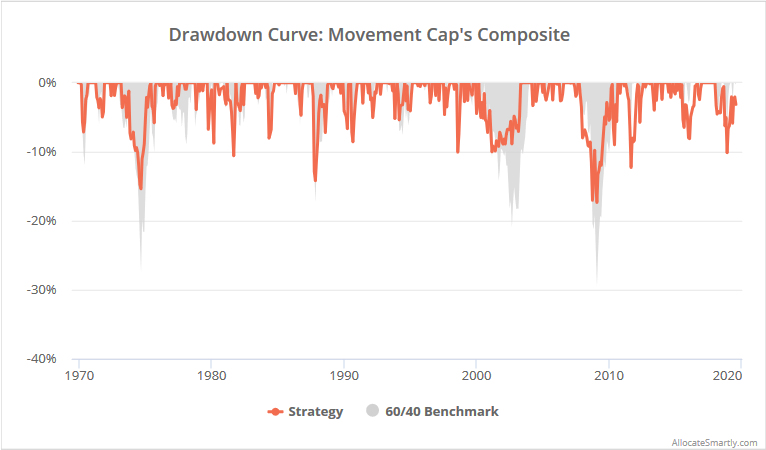
This is a test of Movement Capital’s Composite Strategy. It combines tactical asset allocation with passive buy & hold. This balance between strategy risk and asset risk may be psychologically easier to trade, encouraging investors to stick with a smart investment plan when either style finds itself out of favor. Results from 1970 net of transaction costs follow.
Read about our backtests or let AllocateSmartly help you follow this strategy in near real-time.

Linearly-scaled. Click for logarithmically-scaled chart.
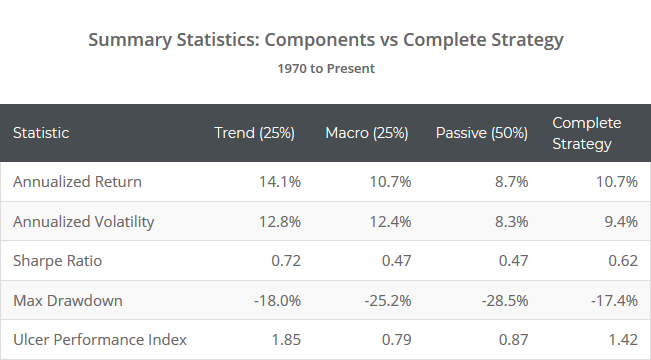
Like other moderate asset allocation strategies that we track, the strength of Movement Capital’s strategy hasn’t been in generating outsized returns, but in maintaining returns while managing losses. Note the reduced max drawdown during the most significant market crises, and the increase in the Ulcer Performance Index in the results below.
This is a simplified version of Movement Capital’s actual strategy. We’ve captured the spirit of the strategy here, but modified the original rules in consultation with the author to fit the standardized approach we take on this site. Over the long-term we would expect both to perform similarly, but they could diverge significantly in the short-term. See the end notes for a full breakdown.
Strategy overview:
The portfolio is split evenly between 4 sub-strategies, half of which are dynamic and half of which are passive. The portfolio allocation each month is determined as follows:
- Trend-Following (25% of portfolio): This is a “dual momentum” approach to trend-following. Measure the momentum of both SPY (US equities) and EFA (intl. equities) using the average of their 3, 6, 9, 12 and 15-month total return. Compare the momentum of the “winner” to the momentum of SHV (short-term US Treasuries). If the winner is greater than SHV, allocate this portion of the portfolio to the winner, otherwise allocate to IEF (int-term US Treasuries).
- Macroeconomic (25% of portfolio): The strategy uses the same three key economic indicators as a strategy we’ve covered previously, Growth-Trend Timing: Real Retail and Food Service Sales (a measure of economic consumption), the Industrial Production Index (a measure of economic production) and the Unemployment Rate (a measure of economic health). Unless 2+ indicators are signaling a recession, split this portion of the portfolio evenly between SPY and EFA, otherwise allocate to IEF.
- Passive Stocks (25% of portfolio): Split evenly between SPY (US equities) and EFA (intl. equities). US stocks represent roughly half of the global stock market, so this avoids home country bias.
- Passive Bonds (25% of portfolio): Split evenly between IEF (int-term US Treasuries) and TIP (US TIPS). As Movement Capital shows here, this avoids an implicit bet on the level of future inflation.
Positions are executed at the close on the last trading day of the month. We assume that the entire portfolio is rebalanced monthly. All positions held until the last trading day of the following month.
Balancing strategy and asset risk:
Like other moderate asset allocation strategies that you’ll find here, the strength of Movement Capital’s Composite Strategy hasn’t been in generating outsized returns; it has been in maintaining returns while managing losses.
It has a further advantage that few strategies that we track employ: balancing dynamic “strategy risk” with passive “asset risk”. More on this in a moment. First, let’s compare the performance of the various strategy components traded in isolation.

Logarithmically-scaled. Click for linearly-scaled chart.
It would have been easy for the author to just trade the Trend component alone, because viewed from 30,000 feet, its performance has been superior. This concentrated approach is taken by most of the strategies that we track.
The problem is that in the real-world, investors don’t judge strategies from 30,000 feet; they judge them month in and month out. Short periods of significant underperformance cause investors to make poor decisions, usually at the worst possible time by exiting strategies low and entering strategies high.
Performance of the dynamic half of this strategy is primarily driven by “strategy risk”, while performance of the passive half is primarily driven by “asset risk” (learn more). At any given time, one or the other will find itself in favor. During bull markets, asset risk tends to outperform, because anything other than long risk to the gills is a suboptimal choice. During turbulent markets, strategy risk tends to outperform, because most tactical approaches are quick to avoid losses.
By balancing the two, we help to ensure that whatever market is presented to us, we’re less likely to drastically underperform. To illustrate, in the chart below we show the 12-month outperformance (positive values) or underperformance (negative values) of the trend component, versus the complete strategy.
Note the frequent seesawing back and forth. Had we just traded the “superior” trend component, we would have been highly likely to change our approach at the low points, which in all cases would have been a bad decision.
This is not the same as simply buying the market. It’s a balance. Enough permanent market exposure to ensure we capitalize in bull markets, coupled with enough tactical exposure to ensure (if history is any guide) that we manage significant market losses.
Other ways to balance strategy and asset risk:
Few tactical strategies enforce this “all-in-one” balance of strategy and asset risk. The best-known example is Meb Faber’s Trinity Portfolio, which also splits the portfolio into an active and passive half.
In our own trading, we enforce this balance on our own. This site includes a handful of popular buy & hold strategies that members can include in their custom model portfolios. We’ve also built an entire sister site BetterBuyAndHold.com dedicated to creating buy & hold portfolios that are optimized for today’s low interest rate environment.
The important takeaway is that just looking at strategy performance from 30,000 feet is insufficient. We must also consider how the strategy is going to “feel” trading month in and month out, because try as we may to control it, we’re all guilty of sometimes being rash and short-sighted.
Other strategy highlights:
- The strategy has been relatively tax efficient, with 92% of profits coming from long-term capital gains or dividends. I suspect that number would be closer to 100% without the “relative momentum” portion of the trend-following component (learn why). Members, see the Tax Analysis report for a complete breakdown.
- Members, be sure to also check out the Alternate Trading Day analysis for this strategy. Executing at month-end has underperformed all other potential trading days. This indicates a bit of bad “timing luck” in these results, meaning that the true strategy performance (likely a better indicator of out of sample performance) is probably better than what we’ve shown here (read more).
Thank you to Movement Capital for the opportunity to put their Composite Strategy to the test. It takes guts to make your strategy rules open to the public. It takes even more guts to ask an independent 3rd party like AllocateSmartly to put those strategy rules to the test. Movement Capital is doing outstanding work in asset allocation analysis, and we highly encourage you follow them now.
New here?
We invite you to become a member for about a $1 a day, or take our platform for a test drive with a free limited membership. Put the industry’s best tactical asset allocation strategies to the test, combine them into your own custom portfolio, and then track them in near real-time. Have questions? Learn more about what we do, check out our FAQs or contact us.
Calculation notes:
While we’ve captured the spirit of the strategy here, we’ve modified the original rules in consultation with the author in order to fit the standardized approach we take on this site. Over the long-term we would expect both to perform similarly, but they could diverge significantly in the short-term.
- The strategy as originally designed calls for the Vanguard ETFs VTI, VXUS, VGIT, VTIP. We’ve replaced these with SPY, EFA, IEF, TIP (read why). IEF/TIP are of longer duration than VGIT/VTIP, leading to an increase in volatility. While we generally like to do a better job matching authors’ asset choices, it’s difficult to justify adding the slightly shorter duration alternatives for a single strategy.
- The strategy was not originally designed to be a monthly strategy. It rebalances weekly but freezes the strategy’s position for 30 days after a new trade to avoid wash sales. We’ve opted to instead take the monthly approach to match other strategies that we track and allow for “alternate trading day” analysis.
- Note that this represents Movement Capital’s baseline strategy, and in practice, exposure to various elements of the composite strategy is scaled up or down based on an individual’s investment horizon and risk tolerance. Learn more.
Results do not include TIPS exposure (TIP) prior to 1973 due to a lack of accurate asset data. During this period, we’ve replaced allocation to TIPS with intermediate-term US Treasuries (IEF).


