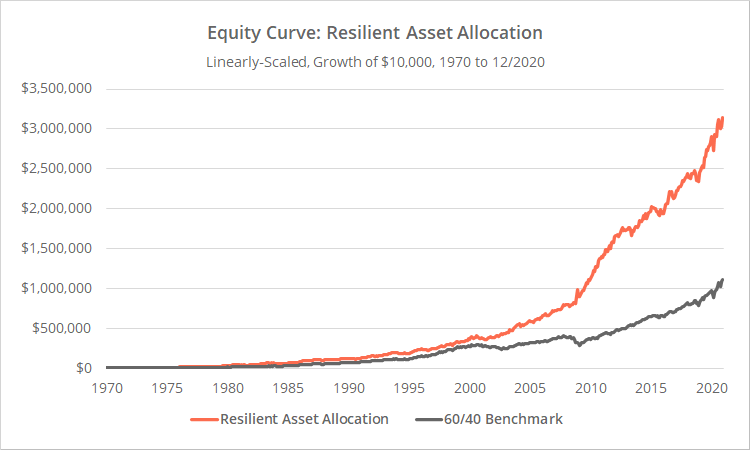
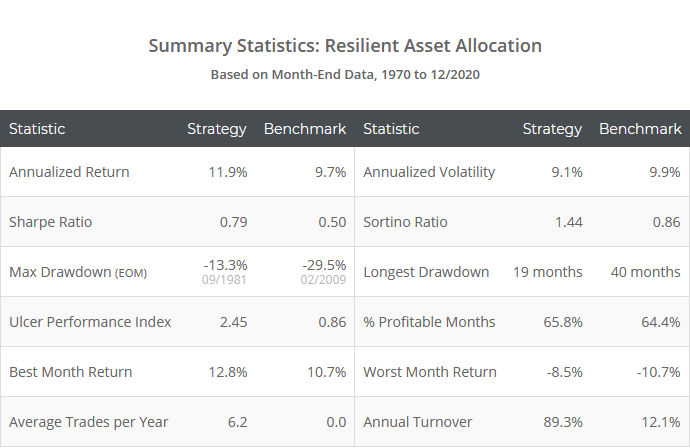
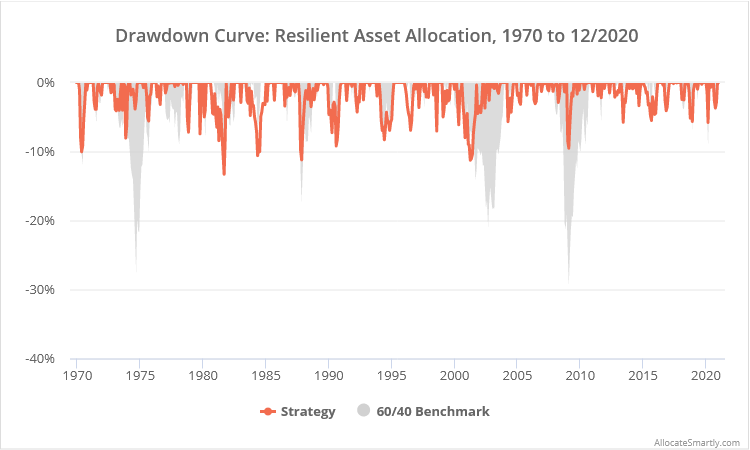
This is a test of the latest tactical strategy from Dr. Wouter Keller: Resilient Asset Allocation (RAA). RAA is intended to be a low turnover strategy, only shifting from a balanced risk portfolio to a defensive portfolio during the most potentially bearish of times.
Backtested results from 1970 follow. Results are net of transaction costs (see backtest assumptions). Learn about what we do and follow RAA and 50+ other asset allocation strategies in near real-time.

Linearly-scaled. Click for logarithmically-scaled results.
Strategy rules tested:
These strategy rules may seem a bit disjointed, but readers who follow tactical strategy development will recognize all of them from other strategies that we track. Like Ilya Kipnis’ Defensive Adaptive, RAA is a “best of” strategy, combining successful elements of other TAA strategies.
Note: This strategy trades on the last trading day of each month, but members can use our platform to follow the strategy on any other day of the month as well.
- At the close on the last trading day of the month, determine if the strategy is “risk on” or “risk off” by first comparing the US unemployment rate at the end of the previous month (t-1) to the unemployment rate 12 months prior (t-13). This 1-month lag is required due to the delay in reporting such data (1) (2).
- If the unemployment rate is less than or equal to 12-months prior, the strategy is risk on.
-
If the unemployment rate is greater than 12-months prior, we defer to a second check; what the author calls the “canary universe”. Calculate a momentum score weighted across multiple time periods for each of two asset classes, emerging markets (EEM) and aggregate US bonds (AGG) as follows:(12 * (p0 / p1 – 1)) + (4 * (p0 / p3 – 1)) + (2 * (p0 / p6 – 1)) + (p0 / p12 – 1)Where p0 = the asset’s price at today’s close, p1 = the price at the close of the previous month, etc. Note how the momentum score weights more recent months over more distant months.
- If the momentum score for either canary asset is less than or equal to 0, the rising unemployment rate is confirmed bearish, and the strategy is risk off. Otherwise, the strategy remains risk on.
- If the strategy is risk on, go long the following diversified risk portfolio at the close: US small cap value (IWN), Nasdaq 100 (QQQ), gold (GLD), intermediate-term US Treasuries (IEF) and long-term US Treasuries (TLT). The portfolio is split evenly (20% allocation to each).
- If the strategy is risk off, go long the following defensive portfolio at the close: int-term US Treasuries (IEF) and long-term US Treasuries (50% each).
- All positions are held until the end of the following month. The portfolio is assumed to be rebalanced monthly.
A “best of” strategy:
Readers who follow tactical strategy development will recognize all of these rules from other strategies that we track:
- Combining trends in the US unemployment rate with trends in price comes from Philosophical Economics’ Growth-Trend Timing (and is employed by multiple other strategies as well). It’s based on the idea that trend-following based on price alone does a good job determining when to switch to defensive assets inside of recessions, but a poor job outside of recessions. Outside of recessions, any deviation from 100% long risk is often a drag on performance, making attempts to finesse positions via trend-following counterproductive.
- The weighted 12-month momentum score, which weights recent months more heavily than distant months, comes from Keller’s own Vigilant Asset Allocation. Doing the math, the most recent 1-month change (p0/p1 – 1) determines 40% of the momentum score, while the most distant month (p11/p12 – 1) determines just ~2%.
- The use of a “canary universe”, i.e. using EEM and AGG to determine the risk state of the portfolio, comes from Keller’s Defensive Asset Allocation (member link). The use of AGG as a canary asset might seem like an odd fit, but as we covered in our test of VAA, momentum in AGG has been a good predictor of short-term risk asset performance.
- The 5-asset portfolio is inspired by Portfolio Charts’ Golden Butterfly and the classic All-Weather Portfolio.
We’re not going to discuss each specific rule because we’ve talked about them previously when we covered the related strategies. We would encourage interested readers to click through the supplied links.
Our take on RAA:
The good:
-
Performance over the entire test was good, but performance over the last couple of decades (especially on a risk-adjusted basis) has been great.Different strategies we track have different backtest start dates (based on data availability), so we use 20 years as a key timeframe throughout the members area in order to compare apples-to-apples. Over that key slice of “recent” performance, RAA exhibits the highest Sharpe Ratio, Sortino Ratio and UPI of any strategy that we track.
-
RAA has done all of that with relatively little trading. It has signaled a change in position just 1.3 times per year on average, resulting in about 6 individual trades per year (3) and an annual portfolio turnover < 1. That makes it easier to trade than most tactical strategies.Having said that, RAA hasn’t been as tax efficient as we expected, generating much more in short-term capital gains than strategies of similar turnover (members: see the Tax Analysis Report). That may or may not matter to investors depending on the account type traded.Why? The majority of the time the strategy was riding a very long position of at least 12 months (71% of all months). These were usually times when the unemployment rate was flat/down trending (67% of all months). But because the “canary universe” concept is so sensitive, in those months when the unemployment rate is up trending, the strategy has frequently bounced between offense and defense, generating lots of short-term cap gains.In other words, most of the time RAA is tax efficient, but when it’s not, it’s really not.
Picking nits:
When members view the list of all strategies that we track in our members area, the initial default sort they see is the 20-year Sharpe Ratio. Our platform allows users to slice and dice strategies umpteen different ways, but we have to default to something, and 20-year Sharpe is it.
As of this moment, RAA is at the top of that list. Even though there are many, many other factors to consider when judging a strategy, RAA’s position at the top of the default sort inevitably means that it’s going to get a lot of attention from members. As a result, we want to judge RAA a little more harshly than a mediocre strategy that, practically speaking, we know few members are trading.
-
The strategy makes heavy use of long duration US Treasuries (IEF and TLT) with no means to shift to shorter alternatives when IEF and TLT are unattractive.As we’ve written about extensively (read more and more), rate sensitive assets face steep headwinds in the coming years. In the short-term they can still generate big returns (and that may be what the author is counting on during risk off months), but in the long-term they will underperform what investors have grown accustomed to over the last four decades.Long duration Treasuries will always be a valuable component of any diversified portfolio (at the very least, as a diversifier), but only in moderation and/or when there’s some mechanism to know when to switch to alternatives. We model each strategy’s exposure to rising rates for members (see the report), and by our math, this strategy is the fourth most vulnerable that we track.What we’d prefer to see, not just from this strategy, but from any strategy that invests heavily in rate sensitive assets, is some quantitative mechanism to know when to shift that allocation to less sensitive alternatives.
-
Like RAA, multiple strategies that we track use the US unemployment rate to time the market, including Philosophical Economics’ GTT, Keller’s LAA, Novell’s SPY-COMP and UI1, and Movement Capital’s Composite strategy. Historically it’s been a highly effective approach, and thus it’s become a bit of a trend in recently released strategies.We like the idea of blending economic data and price analysis as it can provide insight beyond what’s provided by price alone. But we worry when so many strategies start relying on this one particular data point (the unemployment rate), especially when that data point is, by its nature, so slow to respond to market changes.We’d like to see a more diversified ensemble approach that considers other economic data. Barring that, when members choose strategies to combine together into their “model portfolios”, they may want to avoid having too much exposure to this single economic data point via the strategies mentioned above.
Readers shouldn’t take the above criticism as a thumbs down for the strategy. There’s a lot to like about RAA, but as a top performing strategy, it’s important that we judge the strategy a little more harshly than a mediocre one. Further, we’ve found Dr. Keller to be the type of ego-free person that appreciates and considers critical feedback (a key requirement for investment success).
Thank you to Dr. Keller for the opportunity to put this new strategy to the independent test.
New here?
We invite you to become a member for about a $1 a day, or take our platform for a test drive with a free limited membership. Put the industry’s best tactical asset allocation strategies to the test, combine them into your own custom portfolio, and follow them in near real-time. Not a DIY investor? There’s also a managed solution. Learn more about what we do.
End notes:
-
A note about point-in-time versus revised economic data: Economic data is often released at some initial value and then later revised, often multiple times. All of the historical results shown on this site are based on the historical economic data as it looks today. That raises the possibility that the historical signal shown today doesn’t match what would have been signaled in real-time. That’s a risk inherent in trading based on economic data.Philosophical Economics did an excellent analysis of this issue for his Growth-Trend Timing strategies. In short, while it could lead to a different signal in any given month (sometimes for the worse, sometimes for the better), those differences tend to wash over time and have had little impact on long-term performance. Our previous analyses of some of the relevant strategies that we track concurs. All of these strategies include some element of price trend-following (which is unaffected by this data revision issue) that likely serves to keep signals somewhat in-line through any data revisions.
- If attempting to replicate these results, be sure to read this deep dive into how to properly lag monthly economic data.
- The “trades per year” figure excludes monthly rebalances when there isn’t a change signaled in the optimal portfolio allocation. Read more. In other words, these rebalances are included in the strategy performance and turnover results, but not the trades per year stat.


